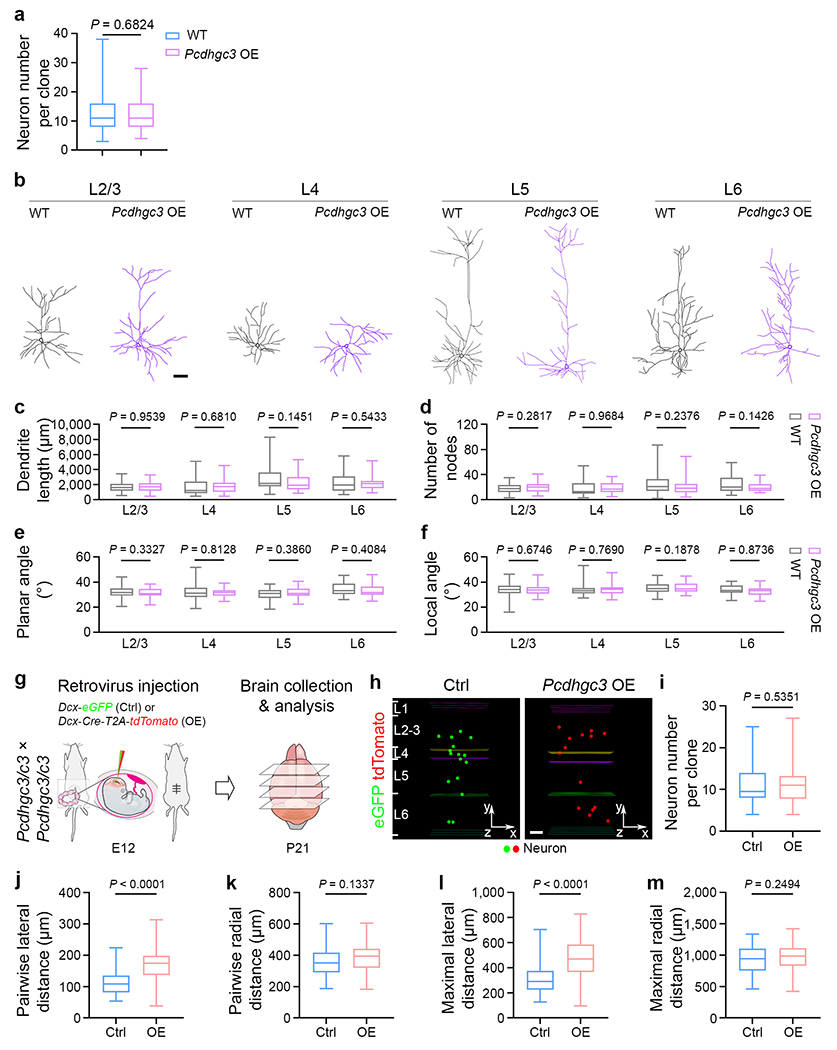
Extended Data Fig. 10. Pcdhgc3 overexpression does not affect the number of clonally-related excitatory neurons or the dendritic morphology.

a, Quantification of the number of neurons in individual WT and Pcdhgc3 OE clones in the neocortex (WT, n = 178 clones; Pcdhgc3 OE, n = 154 clones). b, Representative reconstructed dendritic morphologies of WT and Pcdhgc3 OE excitatory neurons in different layers. Scale bar, 50 μm. c–f, Quantification of the neurite length (c), branch number (d), planar angle (e), or local angle (f) of WT and Pcdhgc3 OE neurons in different layers (L2/3: WT, n = 58; Pcdhgc3 OE, n = 55; L4: WT, n = 17; Pcdhgc3 OE, n = 29; L5: WT, n = 34; Pcdhgc3 OE, n = 30; L6: WT, n = 23; Pcdhgc3 OE, n = 31). The n numbers indicate neurons. g, Schematic diagram of in utero intraventricular injection of low-titre retroviruses with Doublecortin (Dcx) promoter driven eGFP (green, Ctrl) and Cre/tdTomato (red, Pcdhgc3 OE) into the Pcdhgc3/c3 mice at E12. h, Representative 3D reconstruction images of the control and Pcdhgc3 OE clones. Note that the Pcdhgc3 OE clones are more laterally dispersed than the control clones. Scale bar, 100 μm. i, Quantification of the number of neurons in individual control and Pcdhgc3 OE clones (Ctrl, n = 62 clones from ~255 brain slices/4 brains; Pcdhgc3 OE, n = 66 clones from ~260 brain slices/4 brains). j-m, Quantification of the pairwise (j, k) and maximal (l, m) lateral and radial distances between neurons in individual control and Pcdhgc3 OE clones (Ctrl, n = 62 clones; Pcdhgc3 OE, n = 66 clones). Data are representative of four (a), ten (b-f), or three (g-m) independent experiments. Two-tailed unpaired Student’s t-test was used for statistical test. Box plots as in Fig. 1.
