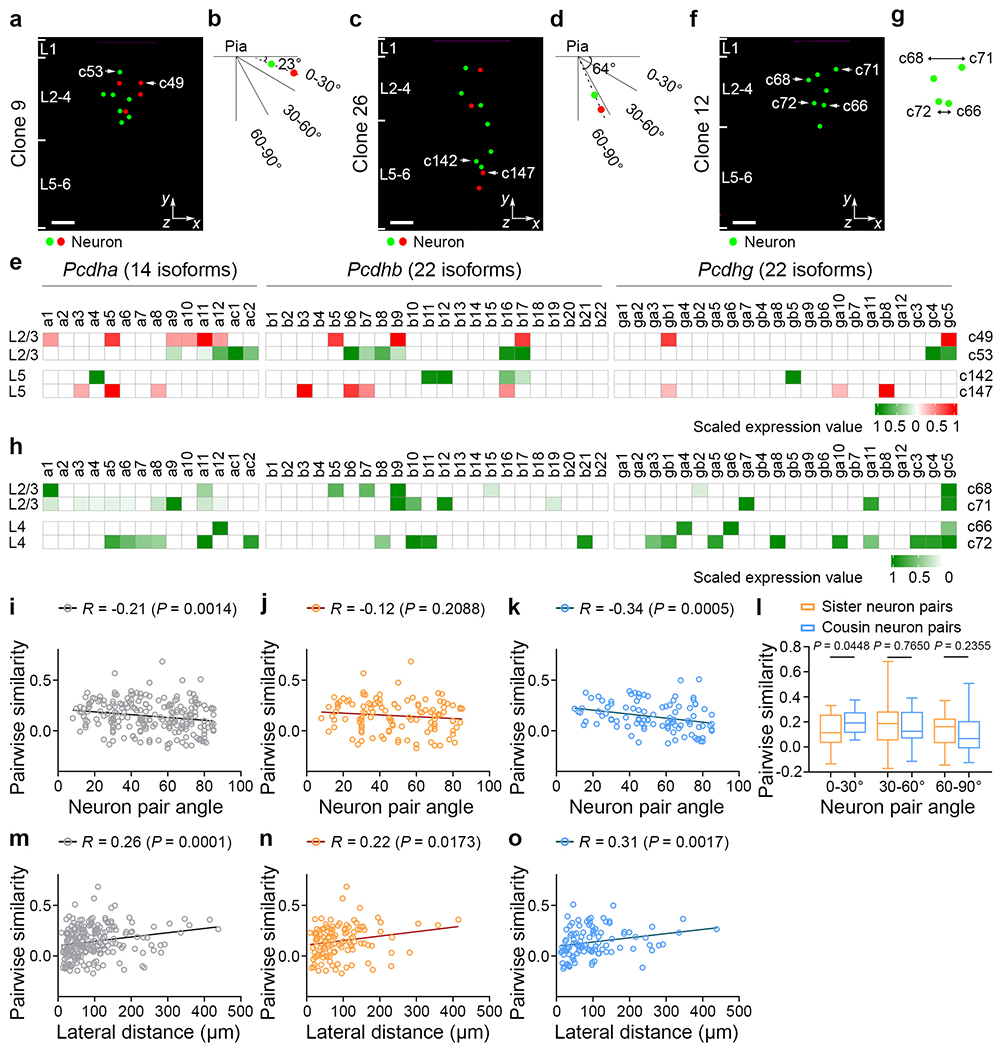
Fig. 2. Coupling between cPcdh expression and spatial configuration of the clone.

a-d, Representative 3D reconstruction images (a,c) and diagrams (b,d) of neurons in the same layers with different spatial configuration for clones 9 (a,b) and 26 (c,d). For a and c, scale bars, 100 μm. e, Heat map of cPcdh transcripts in neurons of the same layers with a horizontal (top; a and b) or vertical (bottom; c and d) spatial configuration. The colours reflect fluorescent labelling. f,g, Representative 3D reconstruction image (f) and diagram (g) of neurons in the same layers with different lateral dispersion. For f, scale bar, 100 μm. h, Heat map of cPcdh transcripts for neurons in the same layers with different lateral dispersion. i-k, Spearman correlation analyses between the pairwise similarity of cPcdh transcripts and the angular orientation in the same layers (L2-4 and L5-6) (n = 219 (clone), n = 118 (sister) and n = 101 (cousin)) for total clone neuron pairs (i), sister neuron pairs (j) and cousin neuron pairs (k). For i-k and m-o, each symbol indicates a pair. The solid lines represent the linear regression. l, Quantification of the pairwise similarity of sister and cousin neuronal pairs in different spatial configurations (0-30°: n = 29 (sister) and n = 21 (cousin); 30-60°: n = 47 (sister) and n = 32 (cousin); and 60-90°: n = 42 (sister) and n = 48 (cousin)). m-o, Spearman correlation analyses between the pairwise similarity in cPcdh transcripts and the lateral distance of clonally related excitatory neurons (n = 219 (clone), n = 118 (sister) and n = 101 (cousin)) for total clone neuron pairs (m), sister neuron pairs (n) and cousin neuron pairs (o). Data are representative of at least three independent experiments. Statistical analysis was performed using two-tailed Spearman correlation analysis (i-k and m-o) and two-tailed unpaired Student’s t-tests (l). The box plots are as described in Fig. 1.
