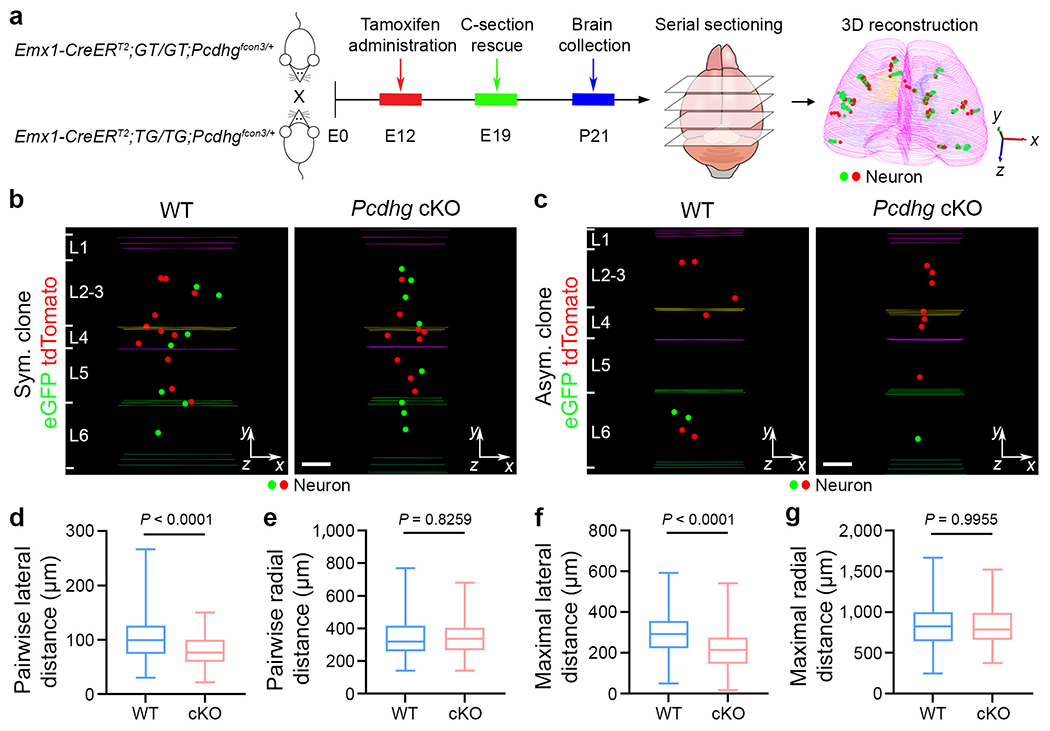
Fig. 3. PCDHγ removal causes a lateral clustering of clonally related excitatory neurons.

a, Diagram of the experimental procedure of MADM-based clonal analysis in the WT and Pcdhg-cKO neocortices. b,c, Representative 3D reconstruction images of P21 WT (left) and Pcdhg-cKO (right) symmetric (Sym.) (b) and asymmetric (Asym.) (c) clones labelled by MADM. The coloured lines indicate layer boundaries. For b and c, scale bars, 100 μm. d-g, Quantification of the pairwise (d,e) and maximal (f,g) lateral (d,f) and radial (e,g) distances between neurons in individual WT and Pcdhg-cKO clones. n = 158 clones, including 68 symmetric and 90 asymmetric clones, collected from around 480 brain sections from 8 brains (WT); and n = 164 clones, including 74 symmetric and 90 asymmetric clones, collected from around 475 brain sections from 8 brains (Pcdhg-cKO). Data are representative of four independent experiments. Statistical analysis was performed using two-tailed unpaired Student’s t-tests (d-g). The box plots are as described in Fig. 1.
