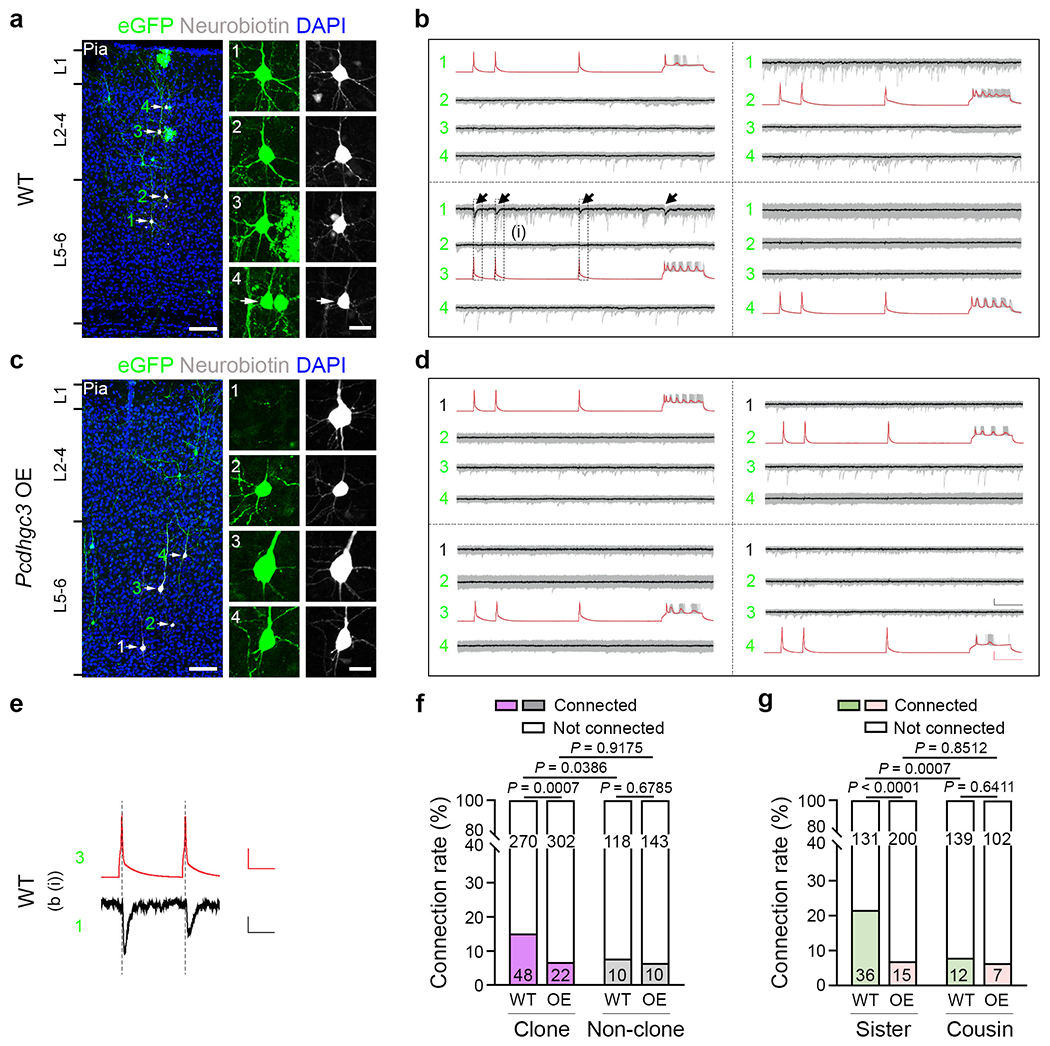
Fig. 6. Pcdhgc3 overexpression disrupts preferential synaptic connectivity between clonally related excitatory neurons.

a,c, Representative confocal images of eGFP-expressing clonally related WT (a, 1-4) and Pcdhgc3-overexpressing (c, 2-4) excitatory neurons (arrows) or nearby unlabelled control excitatory neurons (c, 1) analysed using whole-cell patch-clamp recording. High-magnification images of the cell bodies of the recorded neurons filled with neurobiotin (white) are shown on the right. For a and c, scale bars, 100 μm (left) and 20 μm (right). b,d, Example traces of four excitatory neurons recorded in a (b) and c (d). Individual traces are shown in grey and the average of traces (n = 20-30 (b) and n = 29-30 (d)) are shown in red (presynaptic) or black (postsynaptic). Scale bars, 50 mV (red, vertical), 10 pA (black, vertical) and 100 ms (red and black, horizontal). e, High-magnification traces of the presynaptic action potentials and the postsynaptic responses in the WT clonally related excitatory neurons shown in b (i). Scale bars, 50 mV (red, vertical), 5 pA (black, vertical) and 50 ms (red and black, horizontal). f, Summary of the rate of synaptic connections between the clonally related WT and Pcdhgc3-overexpressing excitatory neurons and nearby non-clonally related excitatory neurons. WT: n = 318 (clone) and n = 128 (non-clone), around 75 brain slices from 24 brains; Pcdhgc3 overexpression: n = 324 (clone) and n = 153 (non-clone), around 85 brain slices from 29 brains. g, Summary of the rate of synaptic connections between the WT and Pcdhgc3-overexpressing sister (n = 167 (WT) and n = 215 (Pcdhgc3 overexpression)) or cousin (n = 151 (WT) and n = 109 (Pcdhgc3 overexpression)) excitatory neurons. For f and g, the n values indicate neuron pairs. Data are representative of at least 20-30 independent experiments. Statistical analysis was performed using two-tailed χ2 tests (f and g).
