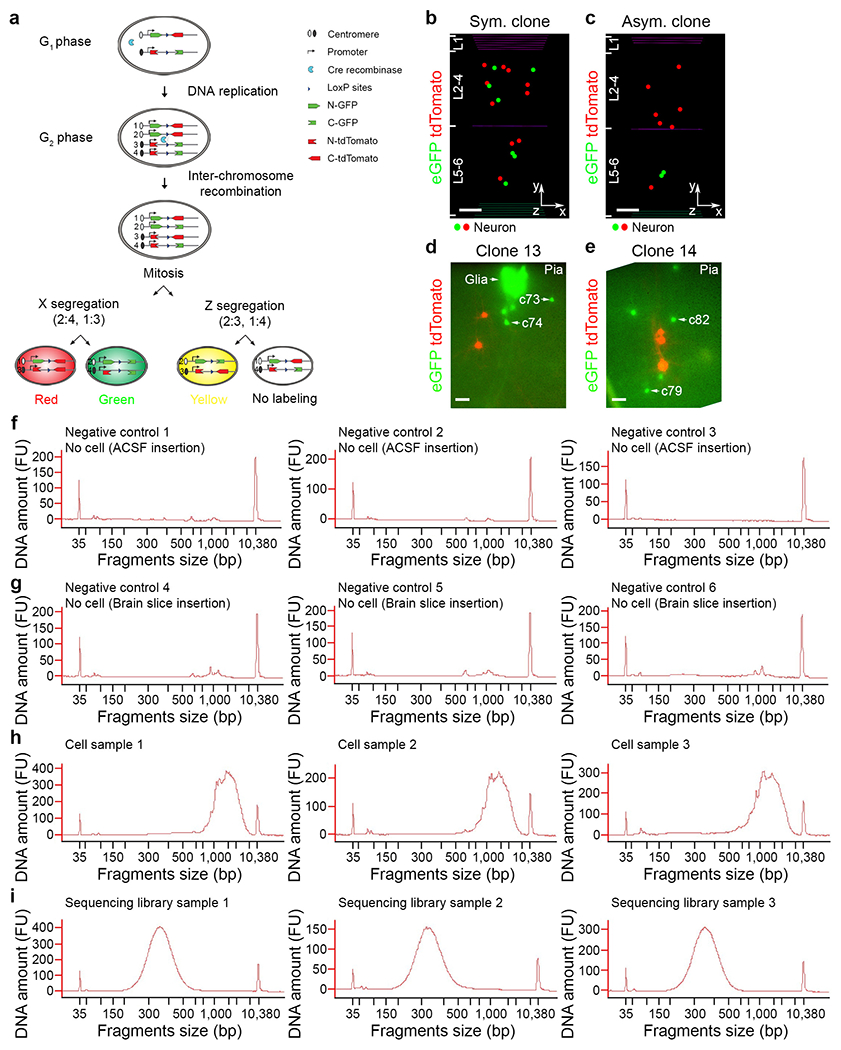
Extended Data Fig. 1. MADM-labelling of individual excitatory neuron clones in the neocortex and quality check of cell aspiration and extraction.

a, Schematic diagram of MADM labelling strategy. b, c, Representative 3D reconstruction images of symmetric (b) or asymmetric (c) excitatory neuron clones induced at E12 and analysed at P21. Different coloured dots represent the cell bodies of labelled neurons. The x-/y-/z-axes indicate the spatial orientation of the clone with the x-axis parallel to the brain pial surface and the y-axis perpendicular to the pial surface. Coloured lines indicate the layer boundaries. Scale bars, 100 μm. d, e, Representative fluorescence images of individual clones in live brain slices subjected to glass pipette aspiration and extraction shown in Fig. 1b and c. Scale bars, 50 μm. f-h, Quantifications of amplified cDNAs from negative controls (f, g) or individual extracted neurons (h) in the same experiment setting. i, Quantification of the cDNA library of individual extracted neurons. Data are representative of at least three independent experiments.
