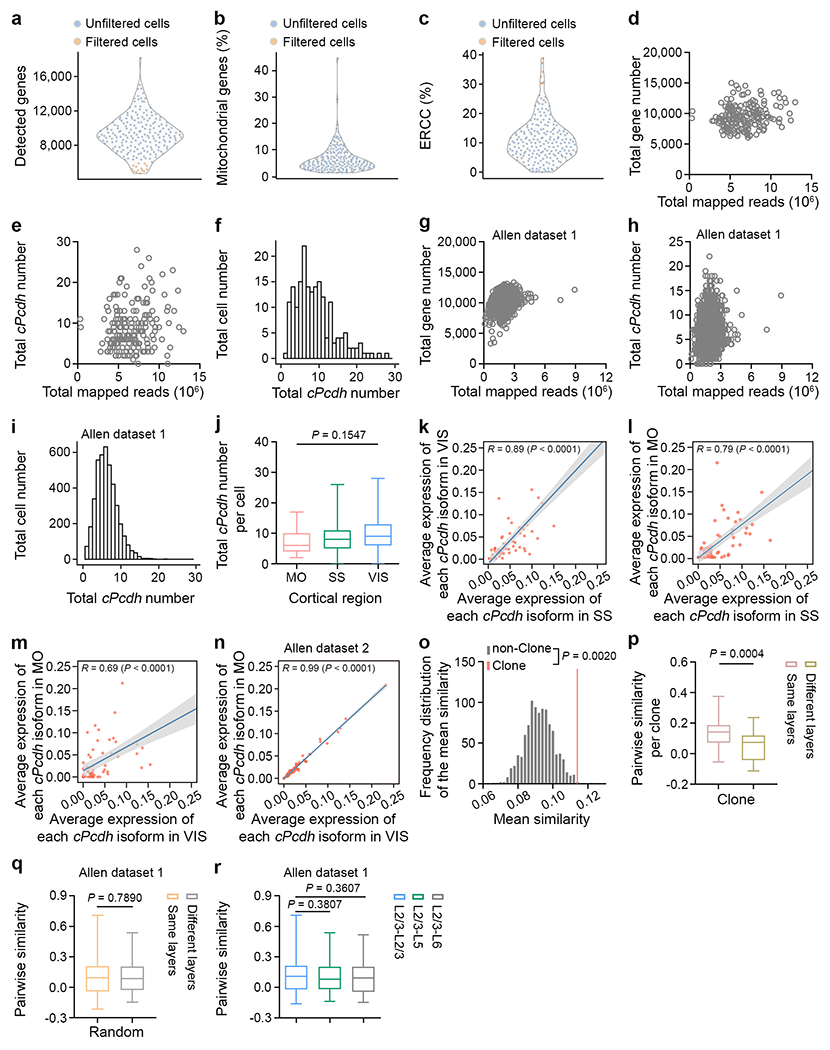
Extended Data Fig. 2. Quality check of the scRNA-seq analysis.

a-c, Quality control of individual extracted neurons after sequencing. Neurons with a low total detected gene number (n = 14), or a high mitochondrial gene (n = 2), or ERCC (n = 7) percentage (orange) were excluded from further analysis. Each symbol represents a neuron. d, e, Quantification of the number of the total detected genes (d) and cPcdh isoforms (e) in our clone dataset (n = 188). Each symbol represents a neuron. f, Histogram of the number of the detected cPcdh isoforms per neuron in our clone dataset (n = 188). g, h, Quantification of the number of the total detected gene (g) and cPcdh isoforms (h) in the previously published randomly collected neocortical excitatory neuron scRNA-seq dataset from the Allen Institute42 (n = 4,152). Each symbol represents a neuron. i, Histogram of the number of the detected cPcdh isoforms in the previously published randomly collected neocortical excitatory neuron scRNA-seq dataset from the Allen Institute42 (n = 4,152). j, Quantification of the number of the total detected cPcdh isoforms in clonally related excitatory neurons from different neocortical regions (motor cortex/MO, n = 32; somatosensory cortex/SS, n = 116; visual cortex/VIS, n = 40). k, Pearson correlation analysis between the average expression level of each cPcdh isoform in clonally related excitatory neurons of SS (n = 116) and VIS (n = 40). Each dot represents a cPcdh isoform. The grey bar indicates the 95% confidence interval. A similar display is used in subsequent panels (l-n). l, Pearson correlation analysis between the average expression level of each cPcdh isoform in clonally related excitatory neurons of SS (n = 116) and MO (n = 32). m, Pearson correlation analysis between the average expression level of each cPcdh isoform in clonally related excitatory neurons of MO (n = 32) and VIS (n = 40). n, Pearson correlation analysis between the average expression level of each cPcdh isoform in randomly collected excitatory neurons of MO (n = 3,893) and VIS (n = 7,347) in the previously published scRNA-seq datasets from the Allen Institute54. o, Frequency distribution of the mean similarities of cPcdh isoform expression pattern in the non-clonal dataset (n = 1,000 trails, grey bars), and the mean similarity of the clonal dataset (red line) from 32 clones. The non-clonal dataset was generated by a random permutation of the clonal dataset and statistics were performed using the permutation test (see Methods). p, Quantification of the pair-wise similarity of cPcdh isoform expression for clonally related neocortical excitatory neurons in the same or different layers per clone (same layers, n = 31; different layers, n = 20). q, Quantification of the pair-wise similarity of cPcdh isoform expression for neurons in the same or different layers of the randomly collected 150 neocortical excitatory neurons from the previously published Allen Institute dataset42 (same layers, n = 600; different layers, n = 400). r, Quantification of the pair-wise similarity of cPcdh isoform expression for randomly collected excitatory neurons across different layers from the previously published Allen Institute dataset42 (L2/3-L2/3, n = 200; L2/3-L5, n = 200; L2/3-L6, n = 200). The n numbers indicate neurons (a-n), clones (p), and neuron pairs (q, r). Data are representative of at least three independent experiments. One-way ANOVA test without adjusted P value (j); Two-tailed Pearson correlation analysis (k-n); One-tailed permutation test (o); Two-tailed unpaired Student’s t-test (p-r). Box plots as in Fig. 1.
