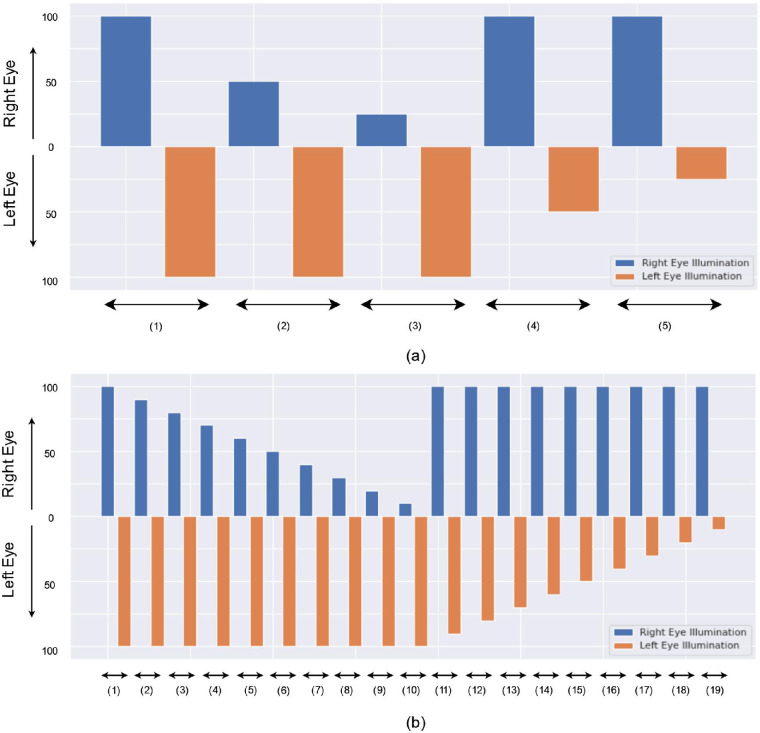
Figure 1.
Plot for illumination level of (a) protocols 1 and 2 and (b) protocol 3. The x-axis represents the number of illumination levels. For each illumination level, respective right and left eye illumination is shown. For example, the second illumination of protocols 1 and 2 is 100% illumination on the left eye and 50% illumination on the right eye, which means at first, the right eye is illuminated with 50% of initial illumination before altering to the left eye with 100% of initial illumination. Each illumination level is repeated three times for protocols 1 and 2 and four times for protocol 3.

