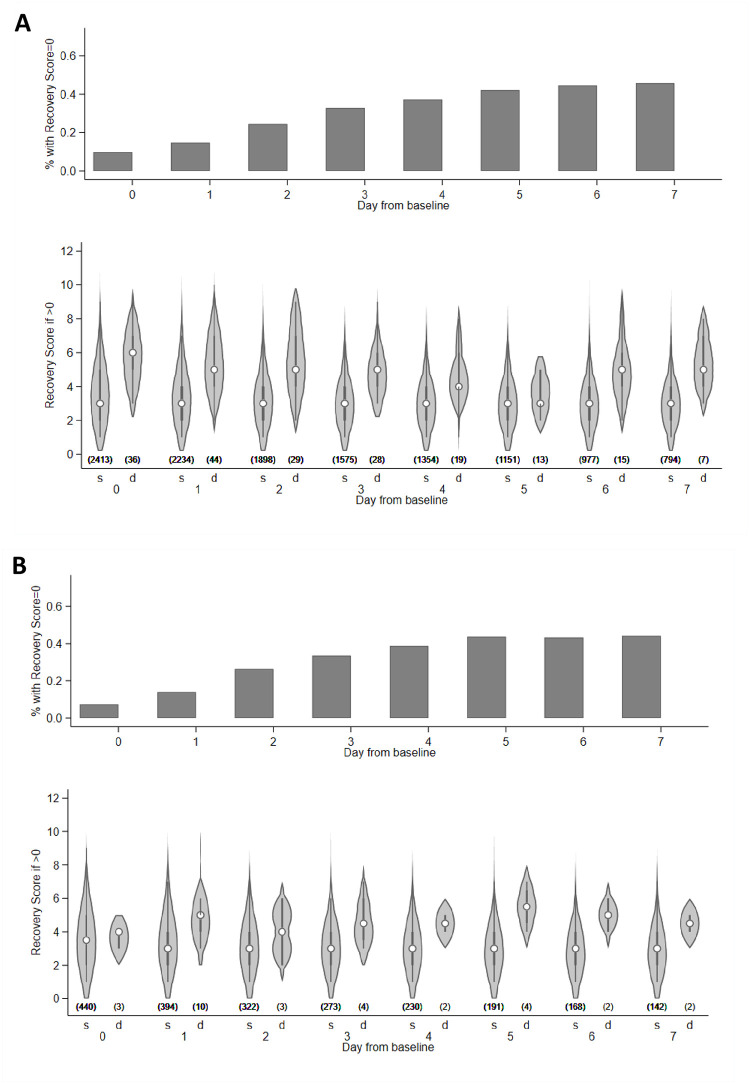
Fig 6. Distribution of the NeoSep Recovery Score.
Distribution of the Recovery Score, based on clinical signs in the last 24 h, in the derivation (A) and validation (B) data. Numbers in parentheses: number of infants per group. s = survived, d = died the next day. Infants who died on same day are excluded for the relevant time points. The violin plots show the distribution of the Recovery Score as density plots plus median, interquartile range, and upper- and lower-adjacent values in infants with a score > 0.

