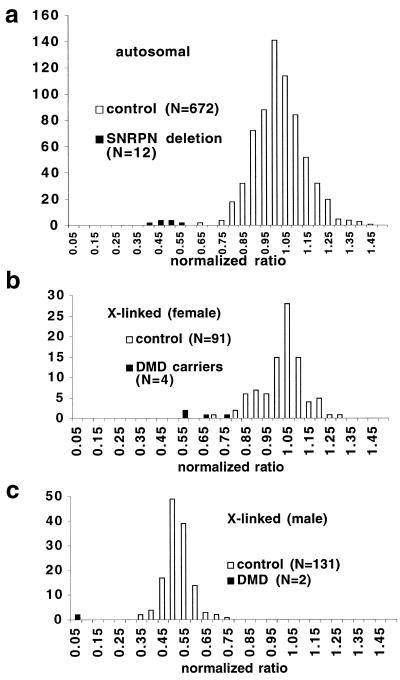
Figure 3.
Quantitative analysis of signal intensity from two separate experiments each examining 12 DNA samples (the 10 individuals shown in Fig. 2 plus two further control samples) with a total of 40 probes. Phosphorimager data were used to produce estimates of relative intensity for each band, with the mean for each probe standardised to 1.0 (see Materials and Methods). Among control samples, ratios centre on 1.0 for autosomal probes and X-linked probes in females, and are clustered around 0.5 for X-linked probes in males.

