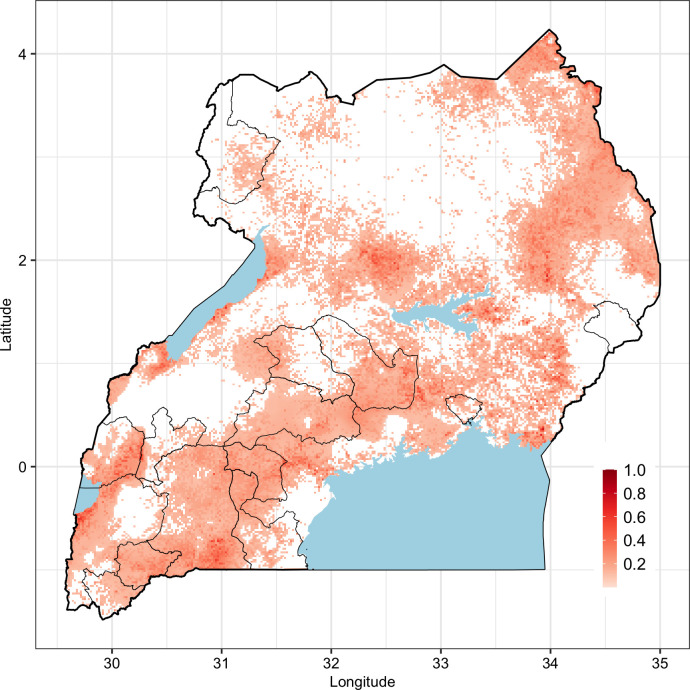
Fig 5. Overlaying maps of historical RVF outbreaks and predicted RVFV seroprevalence in livestock in Uganda.
Shape files used in the figure were obtained from https://www.diva-gis.org/gdata. Areas affected by historical outbreaks are indicated by defined polygons in black border lines.

