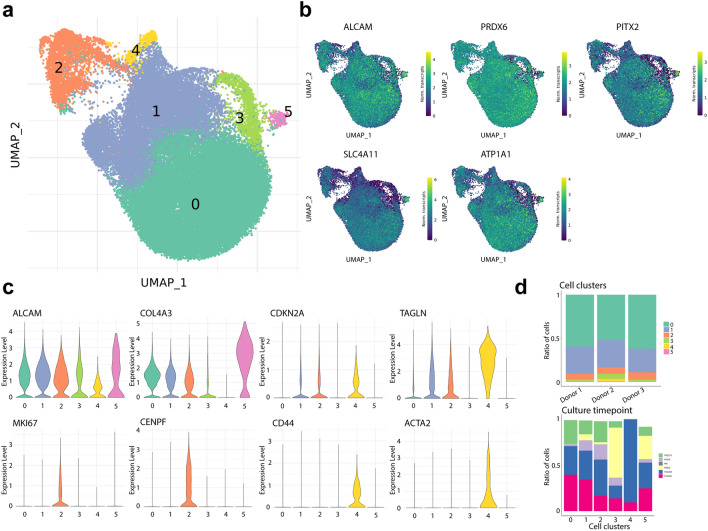
Figure 2.
scRNAseq analysis reveals distinct clusters of primary cultured CECs. (a) UMAP of the 42,220 sequenced cells reveals six cell clusters. (b) Gene expression UMAP of typical CEC markers namely ALCAM (CD166), PRDX6, PITX2, SLC4A11, and ATP1A1 confirms the endothelial identity of the sequenced cells. (c) Violin plots show gene expression for markers of endothelium (ALCAM, COL4A3), senescence (CDKN2A, TAGLN), proliferation (MKI67, CENPF), and fibrosis (CD44, ACTA2). (d) Bar charts show the distribution of cells of each donor per cluster (top) and the time point composition of each cluster (bottom).

