Figure 3.
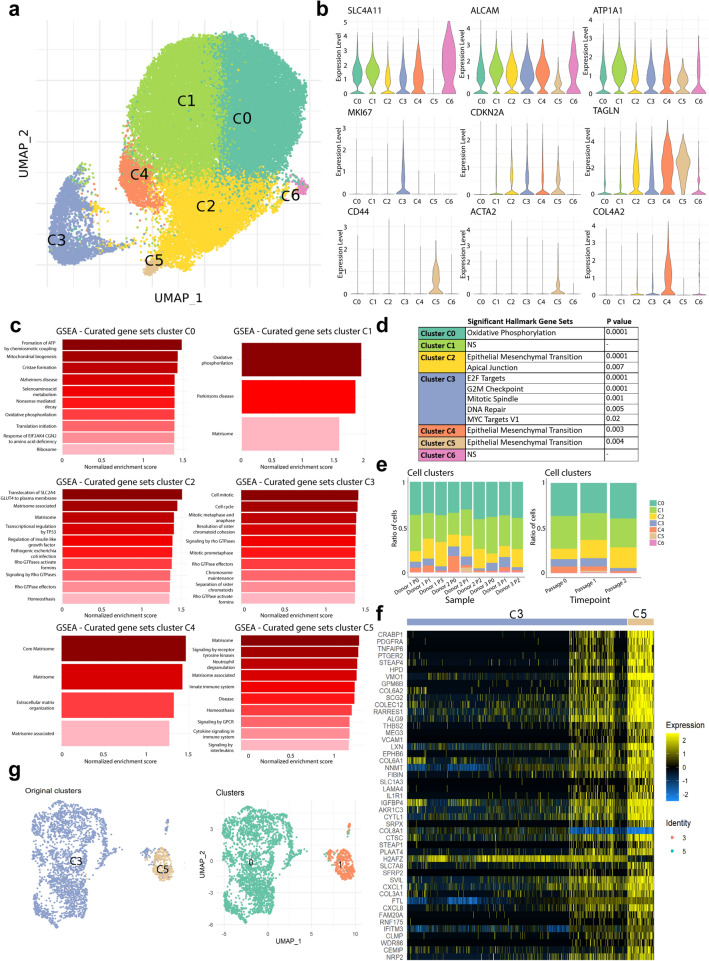
scRNAseq analysis reveals seven distinct CEC clusters at therapeutically relevant time points. (a) UMAP of the 37,158 cells at confluency time points reveals seven cell clusters. (b) Violin plots show gene expression for markers of endothelium (SLC4A11, ALCAM, ATP1A1), proliferation (MKI67), senescence (CDKN2A, TAGLN), fibrosis (CD44, ACTA2), and extracellular matrix production (COL4A2). (c) Gene set enrichment analysis (GSEA) reveal differentially expressed gene sets across cell clusters (p < 0.05). (d) Significant differentially expressed hallmark gene sets across clusters (p < 0.05) show an endothelial to mesenchymal transition in lower quality CEC clusters C2, C4 and C5; and proliferation hallmarks in cluster C3. (e) Bar charts show the composition of cell clusters across the different sequenced samples (left), and across the different time points (right). (f) Heatmap of the top 50 differentially expressed genes across clusters C3 and C5 (p < 0.01) shows a subpopulation of CECs within cluster C3 that highly resembles the cells comprising cluster C5. Heatmap was performed in R (version 4.2.0). (g) UMAP of the reclustering analysis of cell clusters C3 and C5 with original clusters (left) and newly detected clusters (right).

