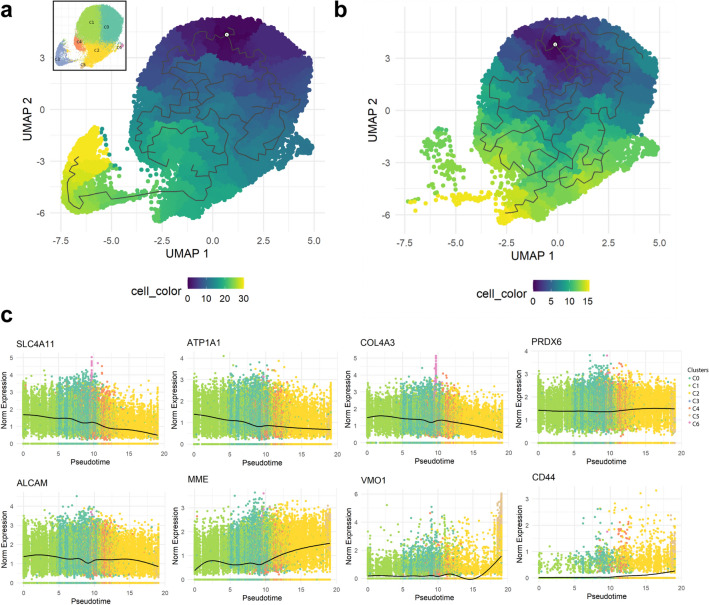
Figure 5.
Pseudo temporal trajectory reconstruction reveals the dynamics of primary cultured CECs. (a) Monocle 3 pseudo temporal trajectory reconstruction on UMAP reduction of the scRNAseq confluency time points reveals the CEC cluster dynamics over primary culture. UMAP reduction is colored by pseudo time bins with dark blue being the earliest and yellow corresponding to late. (b) Monocle 3 pseudo temporal trajectory reconstruction on UMAP reduction of the scRNAseq confluency time points excluding proliferative cluster C3 reduces bias and reveals the temporal dynamics of the CEC clusters at confluence level. UMAP reduction is colored by pseudo time bins with dark blue being the earliest and yellow corresponding to late. (c) Pseudo time reconstruction reveals differential gene expression trends over CEC clusters. Our analysis revealed a reduction over time of CEC markers SLC4A11, ATP1A1, COL4A3, and ALCAM, while PRDX6 expression was constant. Conversely, CD44, MME, and VMO1 expression significantly increased over time.

