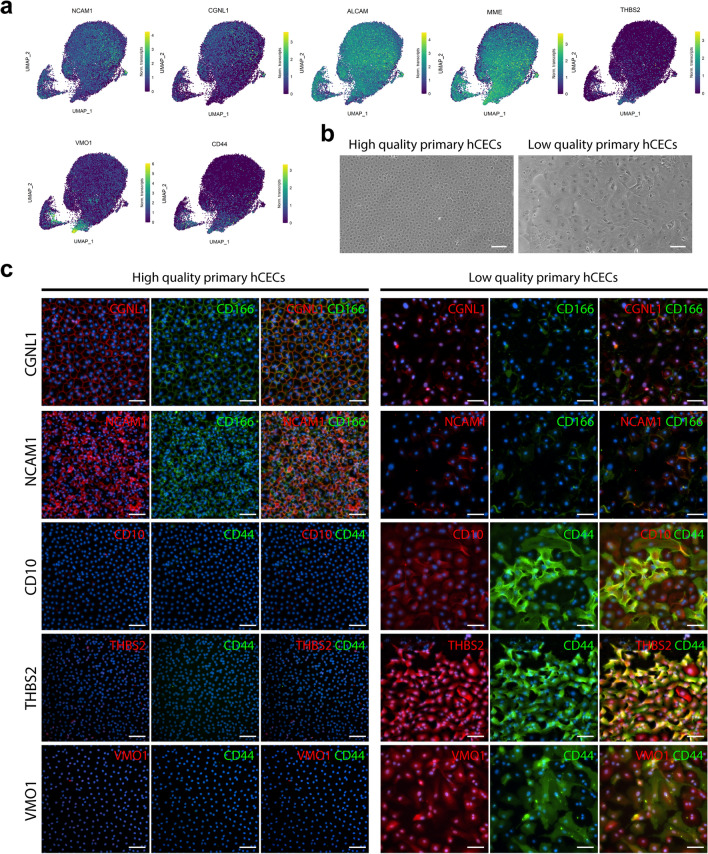
Figure 6.
scRNAseq analysis suggests specific markers for CEC quality assessment. (a) Gene expression UMAP of differentially expressed markers in clusters of therapy-grade CECs (clusters C0 and C1) and clusters of senescent/fibrotic CECs (cluster C5). NCAM1, CGNL1, and ALCAM were differentially expressed in clusters CO and C1 (p < 0.01). MME and CD44 were differentially expressed in clusters C2 and C5. THBS2 and VMO1 were differentially expressed in cluster C5 (p < 0.01). (b) Phase contrast images of a high quality therapy-grade CEC culture showing the typical hexagonal cell morphology and a low quality culture of primary human CECs showing the characteristic morphological alterations of an endothelial to mesenchymal transition. Scale bars represent 100 μm. (c) Immunofluorescence analysis shows expression of CD166 (green), NCAM1 (red), and CGNL (red) in high quality CEC cultures (N = 2) and absence of expression in lower quality CEC cultures (N = 2). Immunofluorescence analysis shows expression of CD44 (green), MME (CD10) (red), THBS2 (red), and VMO1 (red) in lower quality CEC cultures (N = 2) and the absence of expression in high quality CEC cultures (N = 2). Cell nuclei were stained with Hoechst 33342 (blue). Scale bars represent 100 μm.

