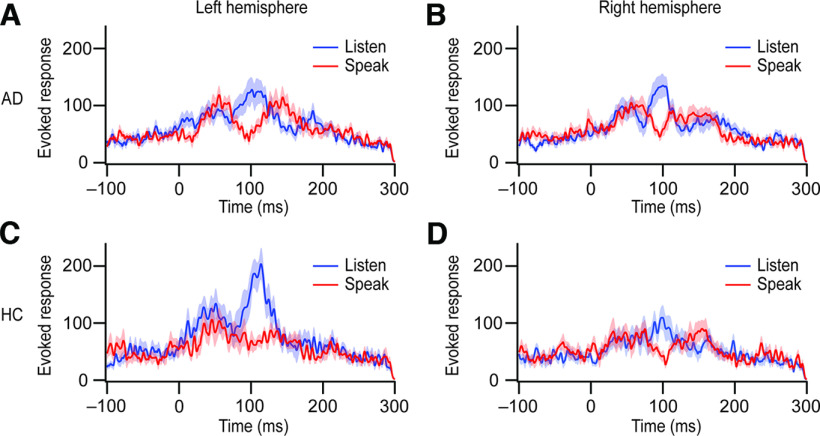
Figure 1.
Auditory cortical time course in both the speaking and listening conditions. MEG traces were aligned to the voice onset. Thick lines denote means, and the shaded regions behind the lines denote SEM (blue, the listening condition; red, the speaking condition). A, B, AD patients’ mean responses (n = 20) for the left hemisphere (A) and the right hemisphere (B) are depicted. C, D, The mean responses for healthy controls (HC; n = 12) are shown in the left hemisphere (C) and the right hemisphere (D).

