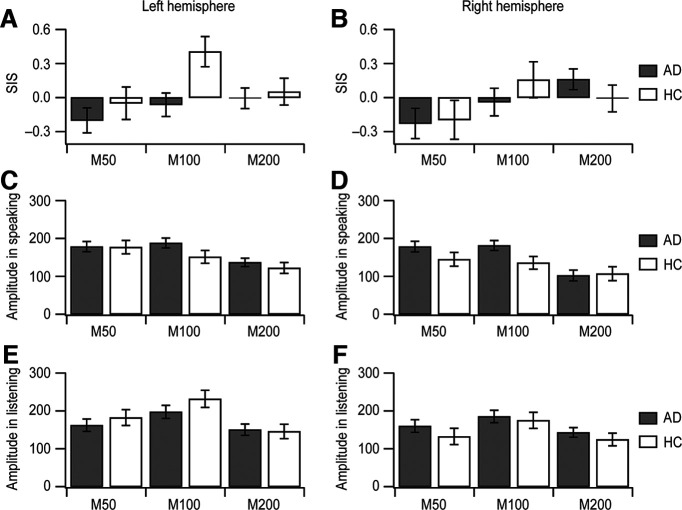
Figure 2.
Amplitudes at M50, M100, and M200 in auditory cortical time course. AD patients’ data (AD; n = 20; mean ± SEM) are presented in gray. Healthy controls’ data (HC; n = 12; mean ± SEM) are in white. A, B, The means of individual SIS magnitudes at each peak are exhibited in the left (A) and right (B) hemispheres. C, D, The means of amplitudes at the three peaks from the cortical activity during speaking are depicted in the left (C) and right (D) hemispheres. E, F, The mean peak values of cortical responses during listening are displayed in the left (E) and right (F) hemispheres.

