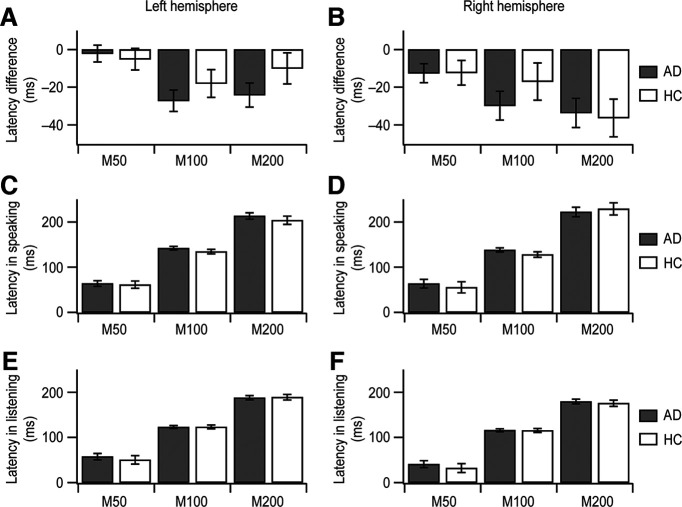
Figure 3.
Latencies at M50, M100, and M200 in auditory cortical time course. AD patients’ data (AD; n = 20; mean ± SEM) and healthy controls’ data (HC; n = 12; mean ± SEM) are gray and white, respectively. A, C, E, In the left hemisphere, the average latencies are depicted in the speaking condition (C), the listening condition (E), and the latency difference between the two conditions (A). B, D, F, In the right hemisphere, the average latencies are shown in the speaking condition (D), the listening condition (F), and the latency difference between the two conditions (B).

