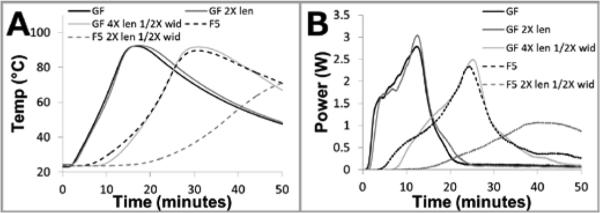
Figure 5.
Data from chemical power source characterization test fixture. A: Experimental time vs. temperature for various saline supply wick geometries. Power sources utilizing both glass fiber (GF) and Fusion 5 (F5) membranes can be tuned using membrane length and width. B: Profiles from panel A converted to time vs. power using the numeric model outlined in the Supplementary Information.

