
Figure 3.
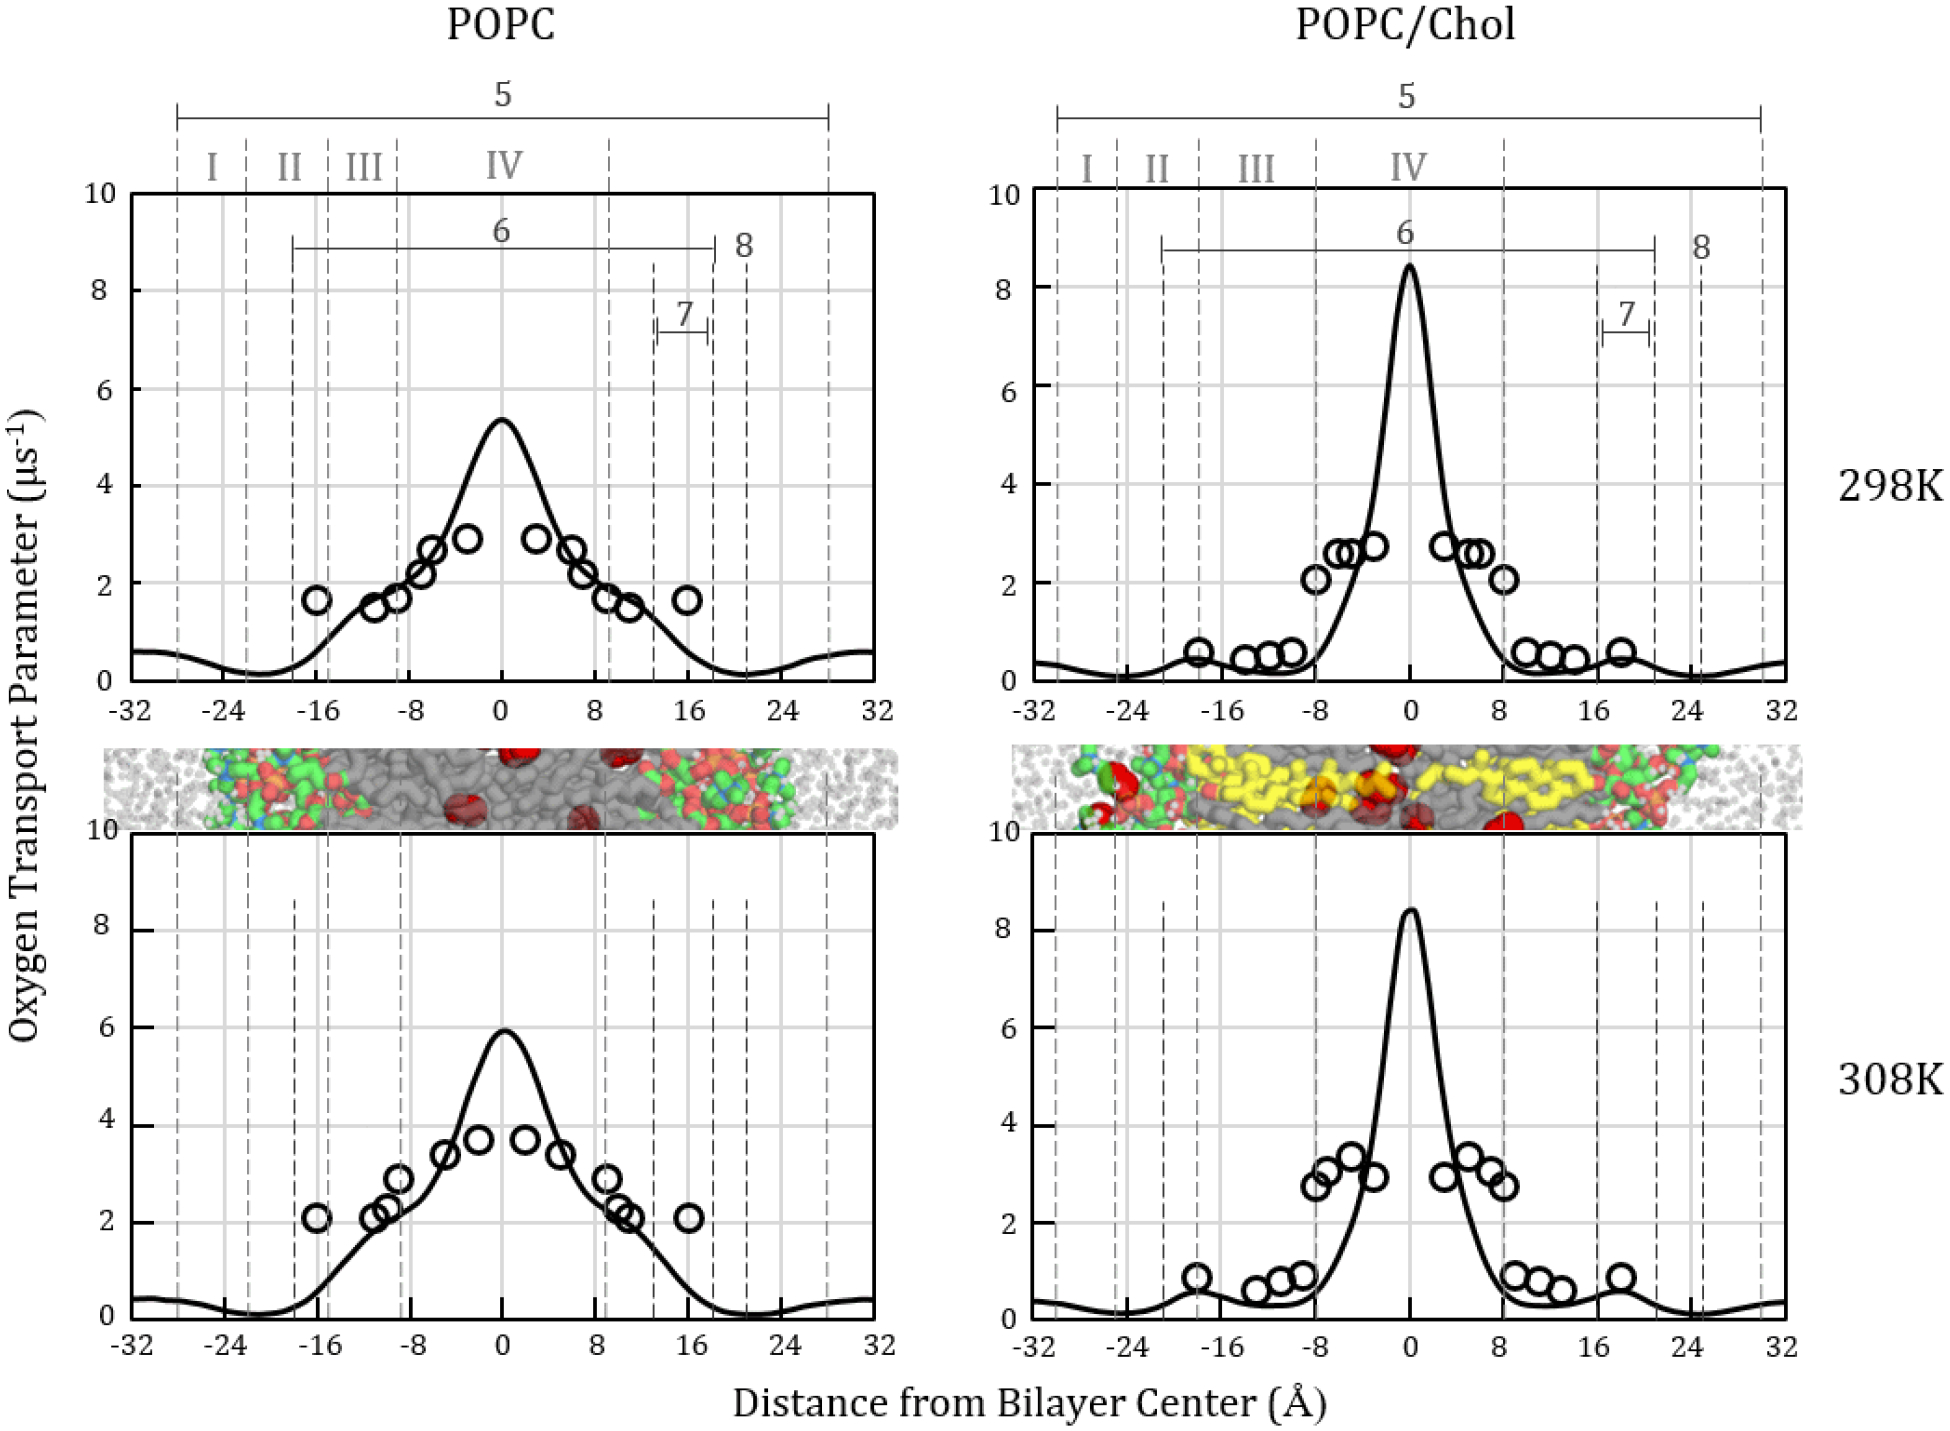
Oxygen transport parameter profiles, W(z), for POPC (left) and POPC/chol (right) calculated from MD simulations at 298 (top) and 308 K (bottom). Simulation-based curves shown as solid black lines. Published experimental EPR values [11,62] shown as hollow circles. Label 5 identifies the simulation bilayer thickness. Label 6 indicates the EPR thickness [11,62]. Label 8 identifies the MD peak resistance to oxygen permeation. Cropped bilayer images are juxtaposed with the plots to show corresponding structural features. Color scheme as in Fig. 1.