
Figure 5.
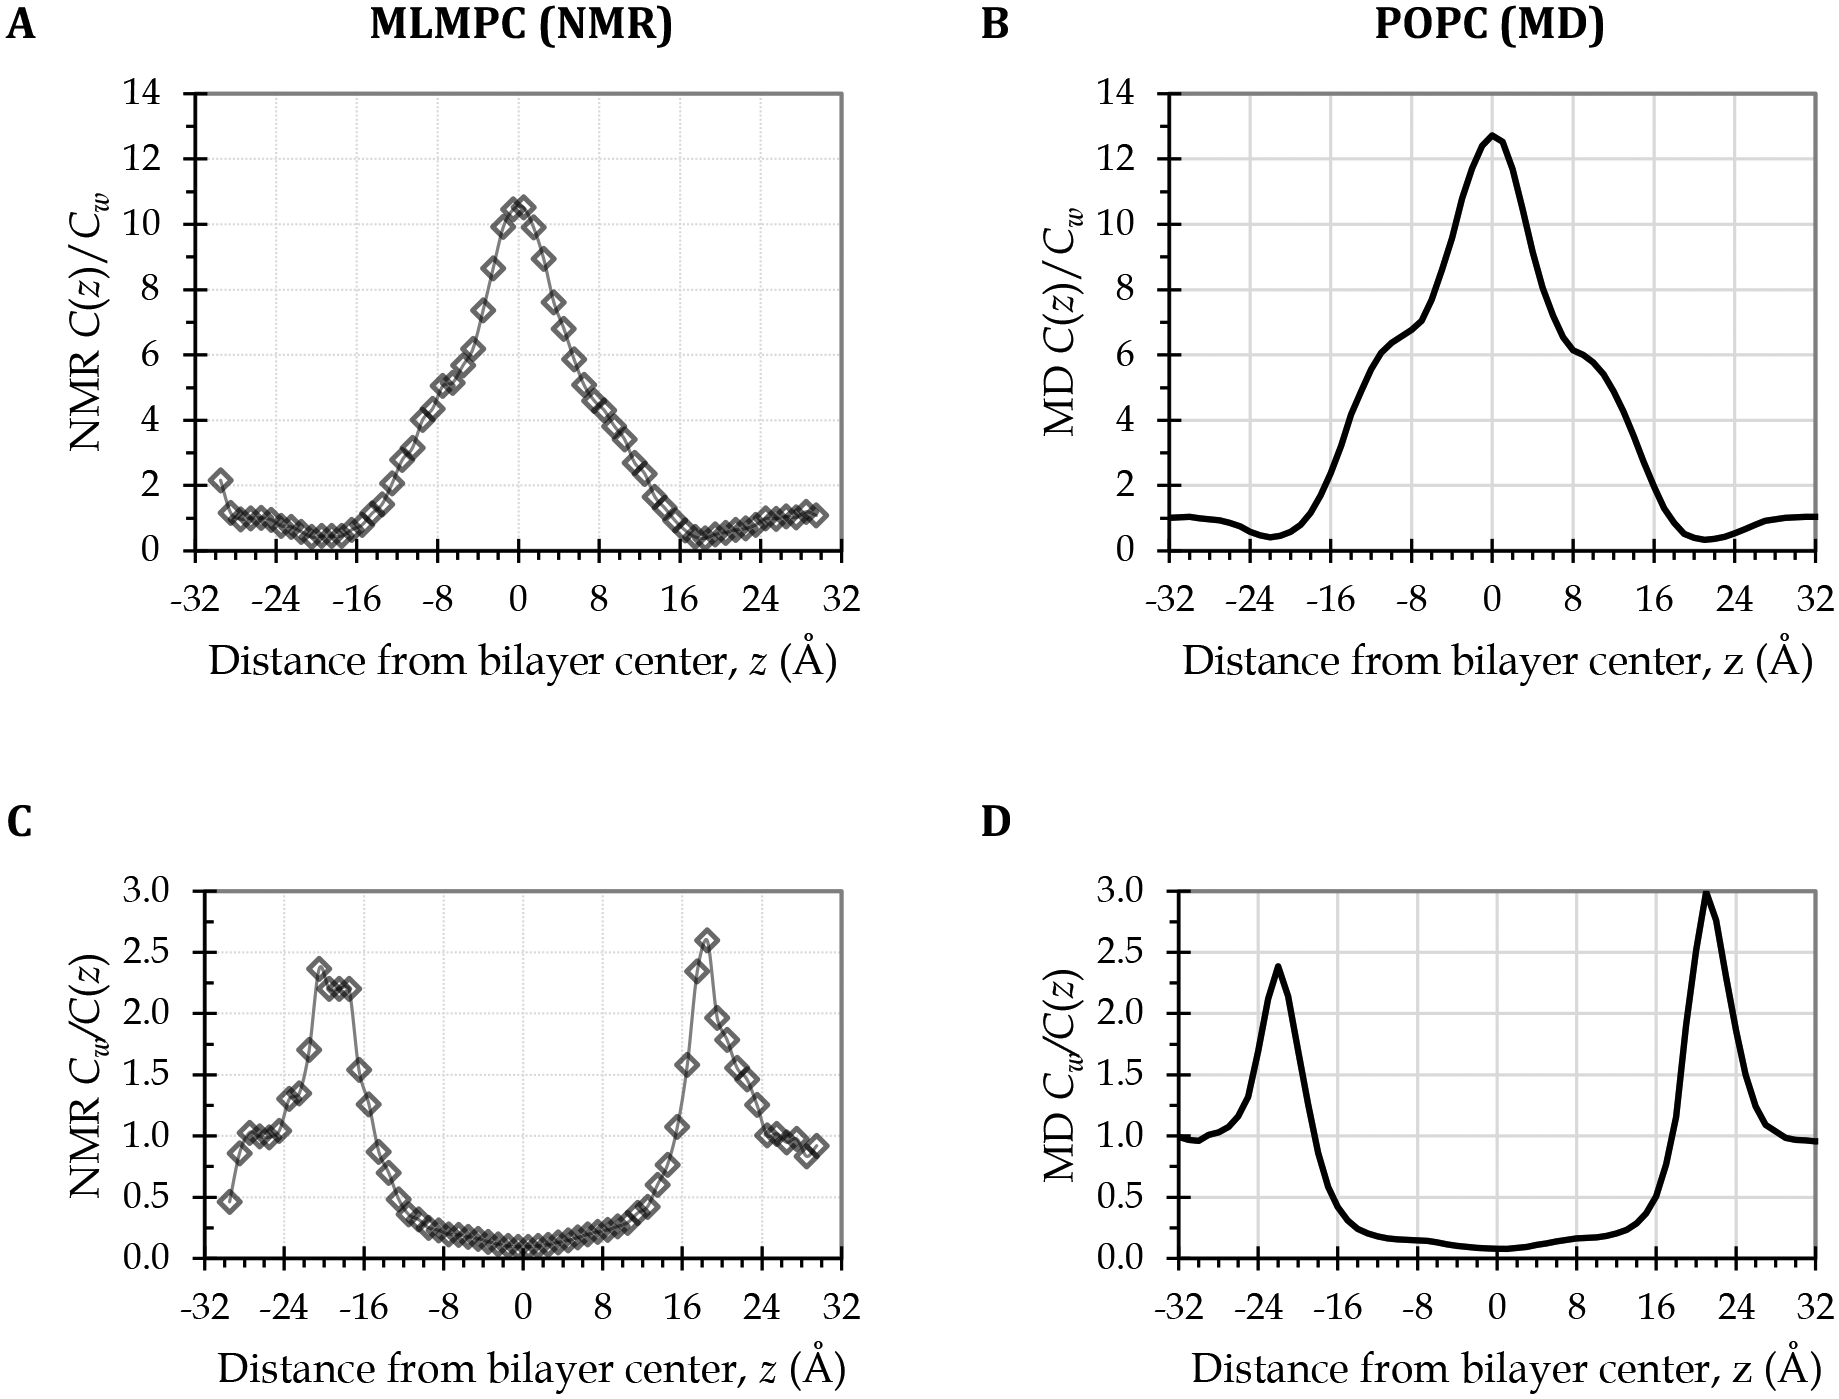
Strong interfacial resistances confirmed by comparing MD simulation curves for POPC (right) with curves derived from experimental NMR O2 concentration data for a single-component phospholipid bilayer (left). (A) NMR-derived depth-dependent O2 concentration curve for a bilayer of the phospholipid 1-myristelaidoyl-2-myristoylphosphatidylcholine (MLMPC) at 318 K [33], normalized to the average water layer O2 concentration, to give C(z)/Cw, or the depth-dependent partition coefficient curve. (C) Inverse of the curve in panel A, equivalent to the O2 concentration component of a resistance to permeation curve. (B) MD-derived C(z)/Cw curve for the POPC bilayer at 308 K. (D) Inverse of the curve in panel B, equivalent to the O2 concentration component of the resistance to permeation curve in Fig. 4, lower left plot.