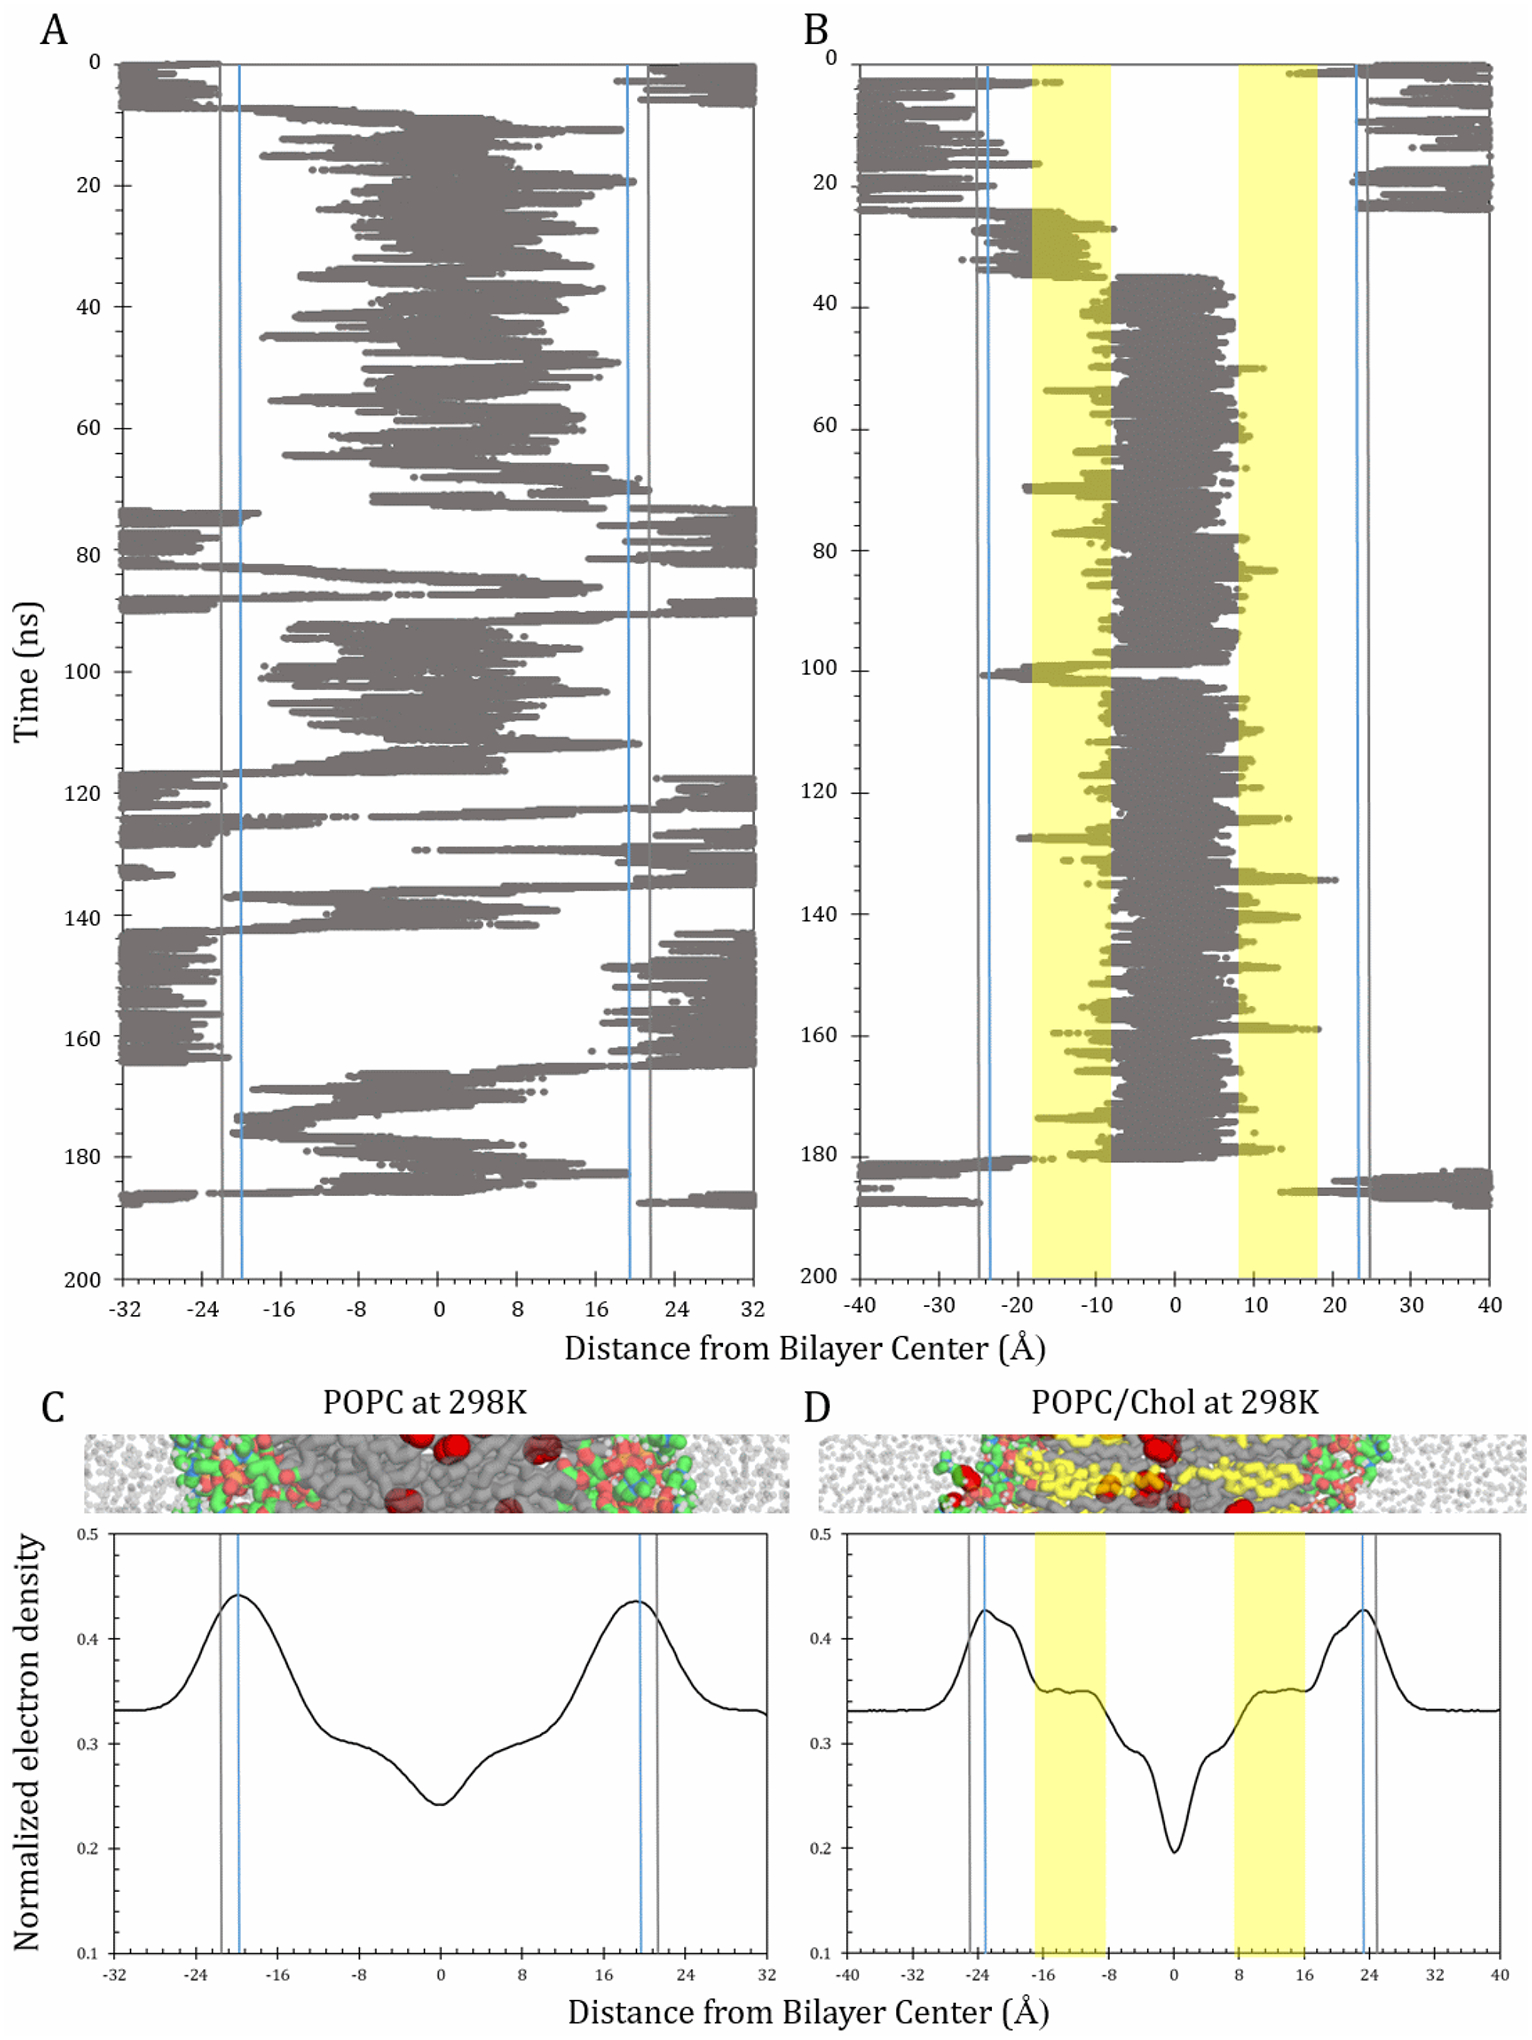
Figure 6.

Time progression plots and electron density curves for POPC and POPC/chol at 298 K. Upper plots show a single representative O2 molecule trajectory each for POPC (A) and POPC/chol (B), along the bilayer-depth dimension, z. Blue vertical lines denote the highest points of electron density, at 19.6 Å for POPC and 23.6 Å POPC/chol. Gray lines indicate the highest point of resistance to permeation, at 21 Å for POPC and 25Å for POPC/chol. Yellow areas in panel B denote the cholesterol-ring-spanning region (III). Lower plots show bilayer-depth-dependent electron density, normalized to give an area under the curve of 1, for POPC (C) and POPC/chol (D). Cropped bilayer images juxtaposed with plots to show corresponding structural features. Color scheme as in Fig. 2.
