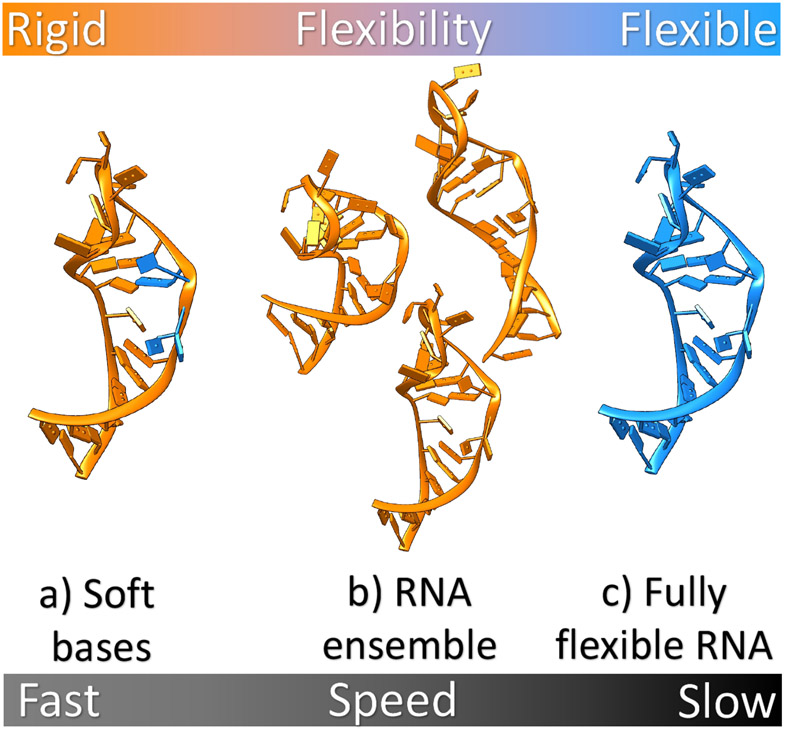
Figure 5:
Different approaches to modeling RNA flexibility in RNA-ligand interactions illustrated using HIV-TAR RNA (PDB: 1ANR (145)) as an example. The orange and blue regions correspond to rigid and flexible portions of RNA, respectively. From left to right, a) bases from the active site are allowed to partially overlap with atoms from ligand through soft potential, b) an ensemble of various RNA conformations is used to perform docking, and c) RNA with full flexibility. Computational efficiency decreases from left to the right.

