
Figure 3.
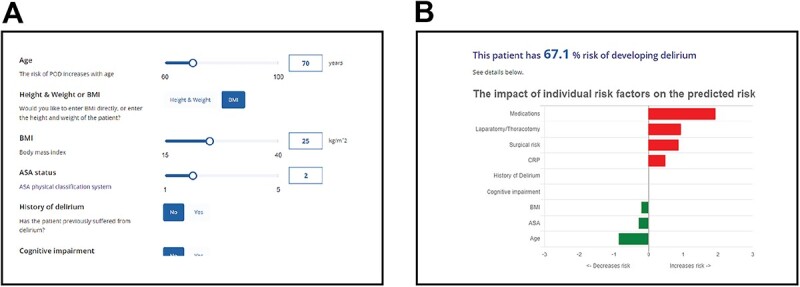
The PIPRA POD risk prediction algorithm clinical interface. Close-up images showing (A) the input screen and (B) the output screen of the web application. The impact of an individual risk factor on the overall risk is shown in comparison with the average (for continuous variables) or the most common (for categorical variables).