Fig. 1.
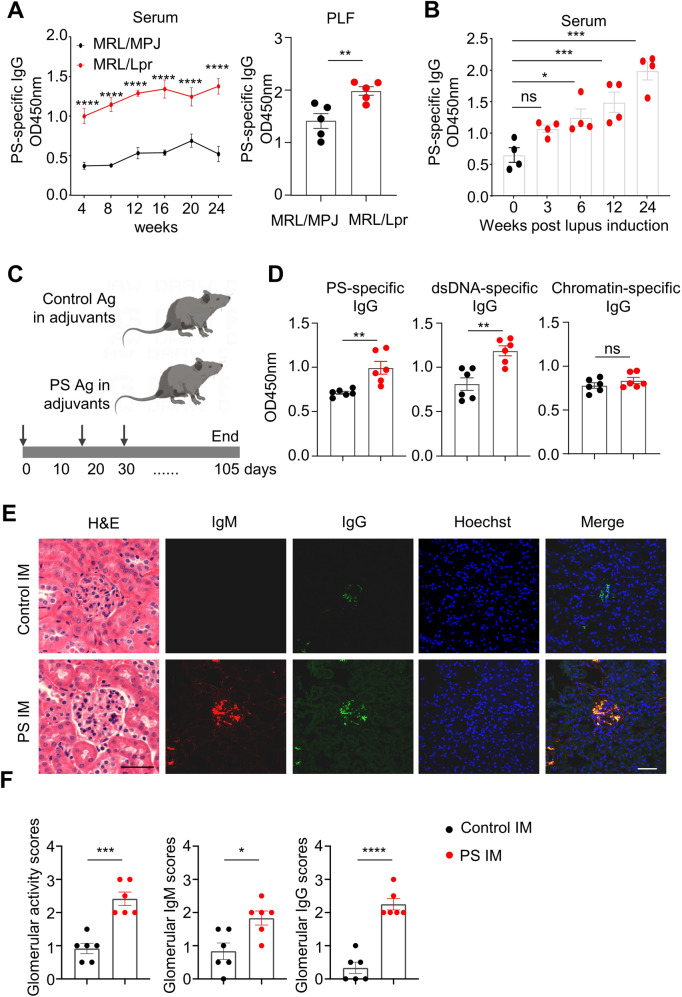
Pathogenic roles of PS-specific IgG in lupus model mice. A Representative data plots show PS-specific IgG in serum samples (1:200 dilution) of age-matched MRL/MPJ and MRL/Lpr mice at 4, 8, 12, 16, 20, and 24 weeks of age (left panel) and in peritoneal lavage fluid (PLF) samples at 12 weeks of age (right panel). B Data plot shows the PS-specific IgG levels in serum samples (1:200 dilution) of mice with chromatin-induced lupus at 0, 3, 6, 12, and 24 weeks (n = 4 per group). C The schematic diagram shows the control or PS antigen (PS:PC = 1:3) immunization in mice. D Representative data plots show serum PS-specific IgG, dsDNA-specific IgG, and chromatin-specific IgG in serum samples (1:200 dilution) of control or PS-immunized mice for 12 weeks (n = 6 per group). E, F Representative images and data plots show H&E staining, IgM, and IgG staining in kidney sections (scale bar, 20 μm) from control or PS-immunized mice for 12 weeks (n = 6 per group). Unpaired two-tailed Student’s t test, ns no significance; *p < 0.05; **p < 0.01; ***p < 0.001; ****p < 0.0001

