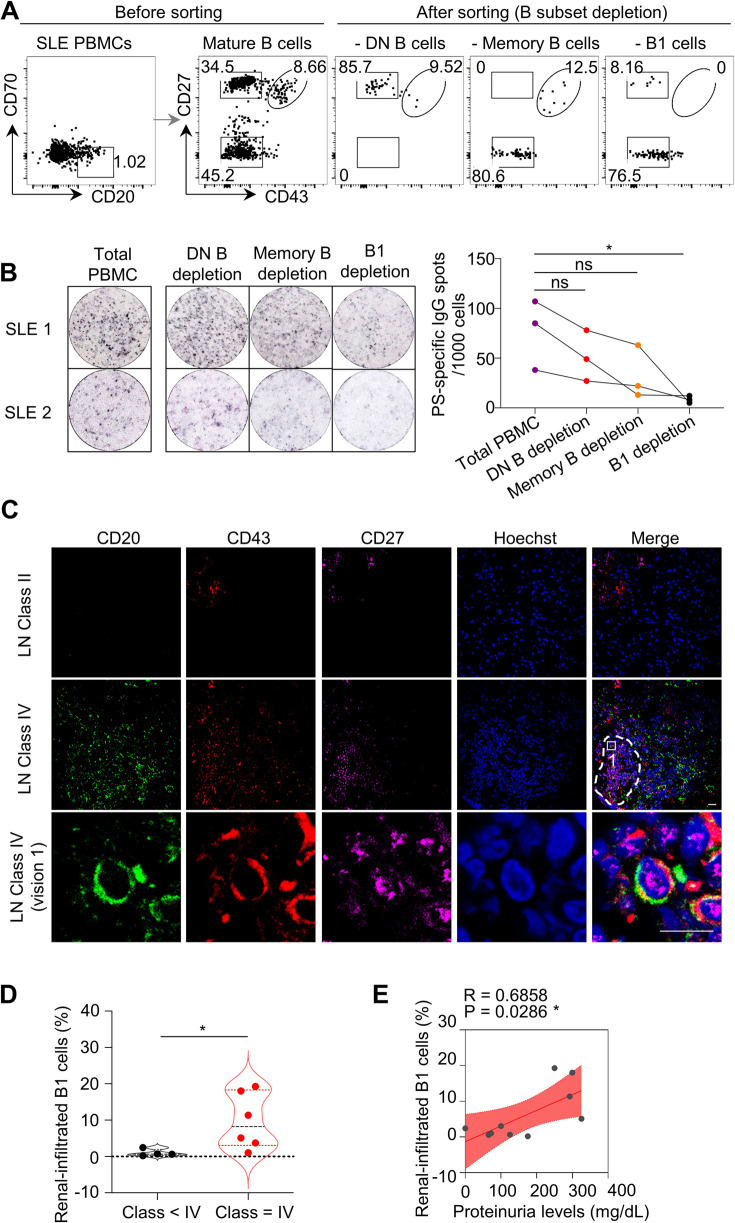
Fig. 4.
B-1 cells are the major source of PS-specific antibodies in SLE patients. A Representative flow cytometric profiles show B subsets, including CD27−CD43− double-negative (DN) B cells, CD27+CD43− memory B cells, and CD27+CD43+ B1-cell depletion by cell sorting in active SLE PBMCs (n = 3). B Representative ELISPOT detections and data plot show PS-specific IgG spots in total SLE PBMCs, SLE PBMCs with DN B-cell, memory B-cell or B1-cell depletion (n = 3). C Representative confocal image shows CD43 (red), CD27 (violet), and CD20 (green) triple-positive B1 cells in kidney biopsies of Class II or Class IV lupus nephritis (LN) patients (scale bar, 20 μm). The white dotted box represents the zoomed-in regions for the visualization of confocal images, and the dashed box represents the regions for B1-cell infiltration in kidney biopsies. D Data plot shows the distributions of percentages of renal-infiltrated B1 cells in LN patients with Class II–III (n = 4) and Class IV (n = 6). E Plot shows correlation analysis between percentages of renal-infiltrated B1 cells and urine protein levels in LN patients (n = 10). One-way ANOVA in (B), nonparametric Mann–Whitney U test in (D) and Spearman’s rank correlation analysis in (E); ns no significance; *p < 0.05

