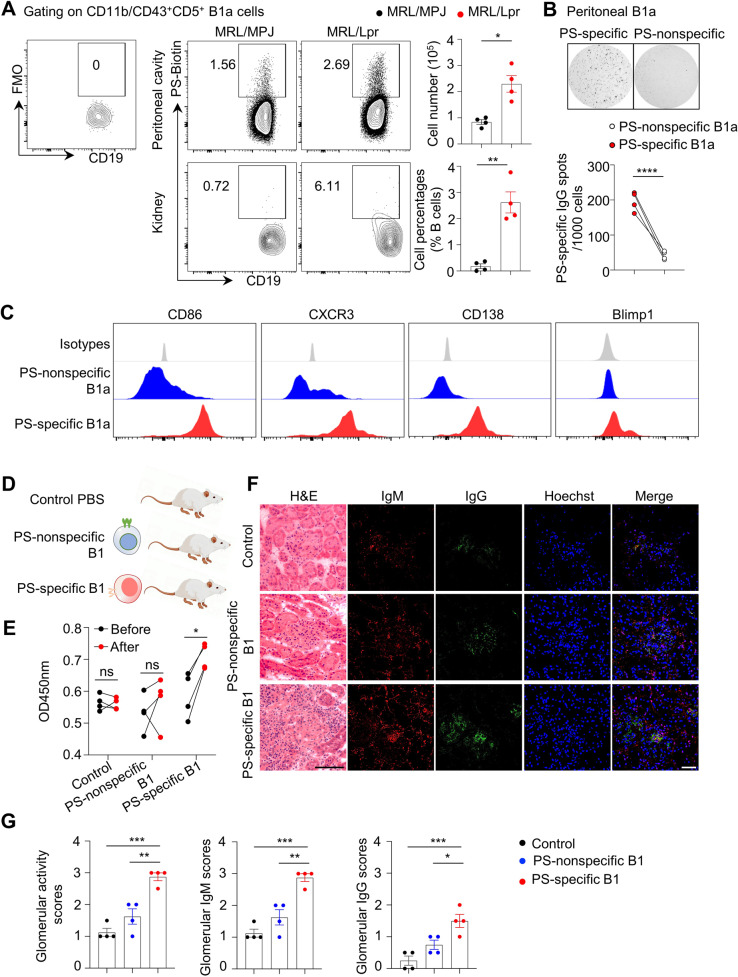
Fig. 5.
Adoptive transfer of PS-specific B-1 cells triggers lupus development in mice. A Representative flow cytometric profiles show PS-specific B1a cells in peritoneal cavities and kidneys of MRL/MPJ and MRL/Lpr mice at 24 weeks of age (n = 4 per group). B Representative ELISPOT detections and data plot show PS-specific IgG spots in sorting-purified PS-specific and PS-nonspecific B1a cells (n = 4). C Representative flow cytometric histograms show the expression profiles in PS-specific B1a cells and nonspecific counterparts from peritoneal cavities of MRL/Lpr mice at 24 weeks of age. D The schematic diagram shows the 6-week-old MRL/Lpr mice adoptively transferred with PS-specific B1a cells and nonspecific counterparts from 24-week-old MRL/Lpr mice (n = 4 per group). E Data plot shows the serum PS-specific IgG levels in recipients before or after cell transfer for 4 weeks by ELISA. F, G Representative images and plots show H&E, IgM, and IgG staining in kidney sections (scale bar, 20 μm) from MRL/Lpr recipients adoptively transferred with PS-specific B1a cells or their nonspecific counterparts for 4 weeks (n = 4 per group). Unpaired two-tailed Student’s t test, *p < 0.05; **p < 0.01; ***p < 0.001; ****p < 0.0001

