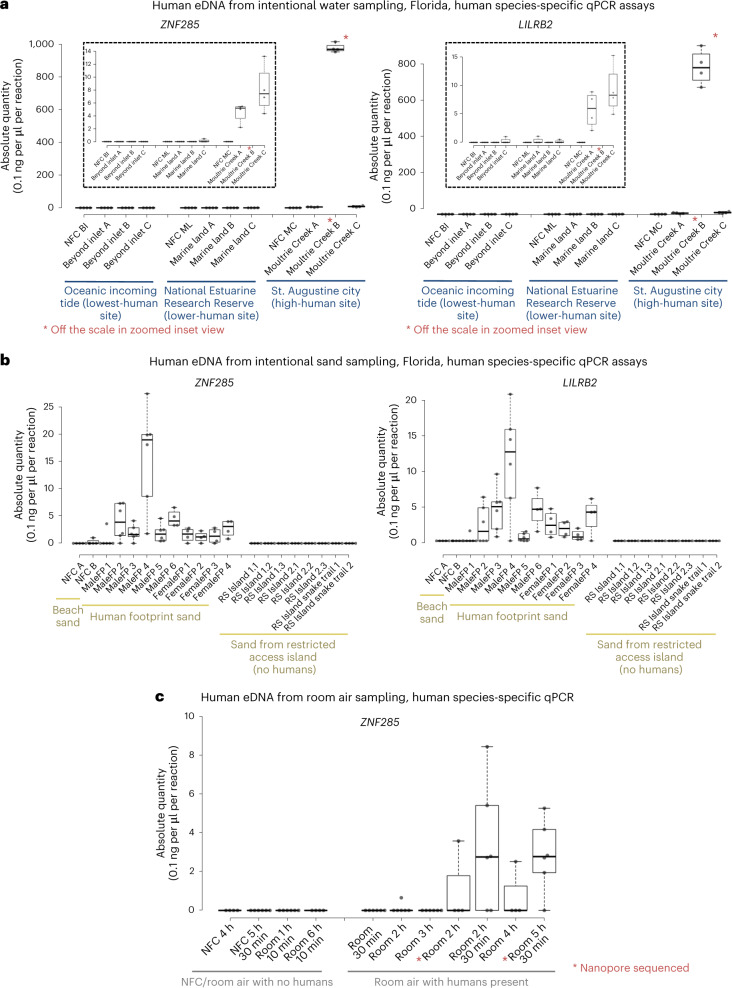
Fig. 2. qPCR-based species-specific quantification of human eDNA from Florida water, sand and air sampling.
a, Water eDNA sampling, qPCR, quantified with ZNF285 (left) and LILRB2 (right) human-specific assays. Insets: enlarged section plot. BI, beyond inlet; ML, marine land; MC, Moultrie Creek. b, Sand eDNA sampling, qPCR, quantified with ZNF285 (left) and LILRB2 (right) human-specific assays. c, Room air eDNA sampling, qPCR, quantified with ZNF285 human-specific assays. The absolute quantity (0.1 ng per μl per reaction) of human eDNA per sample is shown. Each qPCR reaction is a 10 μl reaction containing 1 μl of extracted eDNA template. For filtered water volumes and elution volumes, see Supplementary Table 2. Tukey whiskers (extend to data points that are less than 1.5 × IQR away from 1st/3rd quartile) were utilized for every boxplot. The median for each sample is shown as a horizontal line within each box, and box edges are the upper and lower quartiles. One box is graphed per single sample, consisting of all qPCR technical replicate wells for that sample. Biological replicates are not pooled on any boxplots, with each sample being denoted by its own box.

