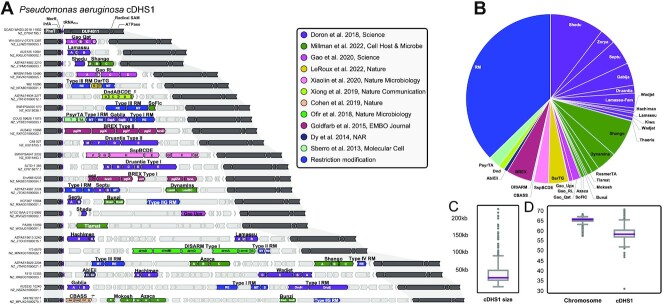
Figure 3.
Core defense hotspot 1 (cDHS1). (A) Representative isolates with cDHS1 chosen to show the diversity in anti-phage systems. Dark gray genes are marker genes that define the boundaries of the hotspot. Light gray genes indicate non-defense genes and are neighbors to the defense system which are colored based on the publication they were discovered in. (B) Pie chart of the different immune systems found in cDHS1, colored by publication. (C) Size distribution of cDHS1 in kb. (D) GC% difference between the host chromosome and the defense hotspot.

