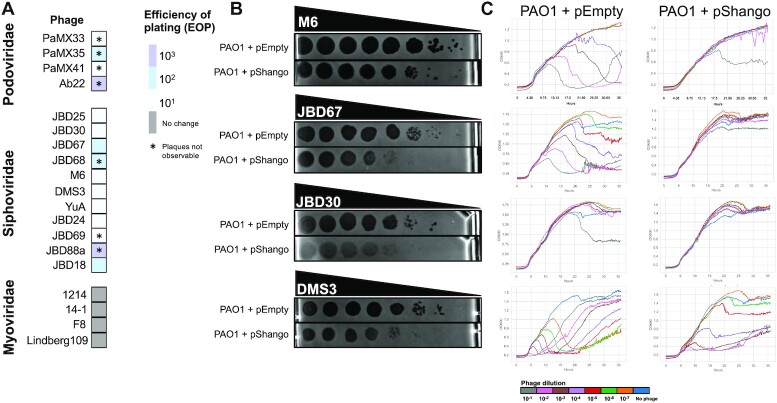
Figure 6.
Shango phage assays. (A) A heatmap of efficiency of plating (EOP) of several different Pseudomonas phage on a strain. EOP is calculated as the ratio of the number of plaques between the PAO1 + pEmpty (empty vector) strain and the PAO1 + pShango expressing strain. Phage are grouped by their morphology type (Myovirus, Siphovirus, and Podovirus). (B) Ten-fold dilutions of phage lysates (spotted left to right) on a lawn of PAO1 + pEmpty or PAO1 + pShango. (C) The same strains and phages were used in liquid infection, where OD600 is plotted to quantify culture lysis due to phage replication. Phage dilutions are labeled at the bottom. Three replicates were performed for liquid and plate assays. Single replicates shown represents the consensus of all three.

