
Figure 1.
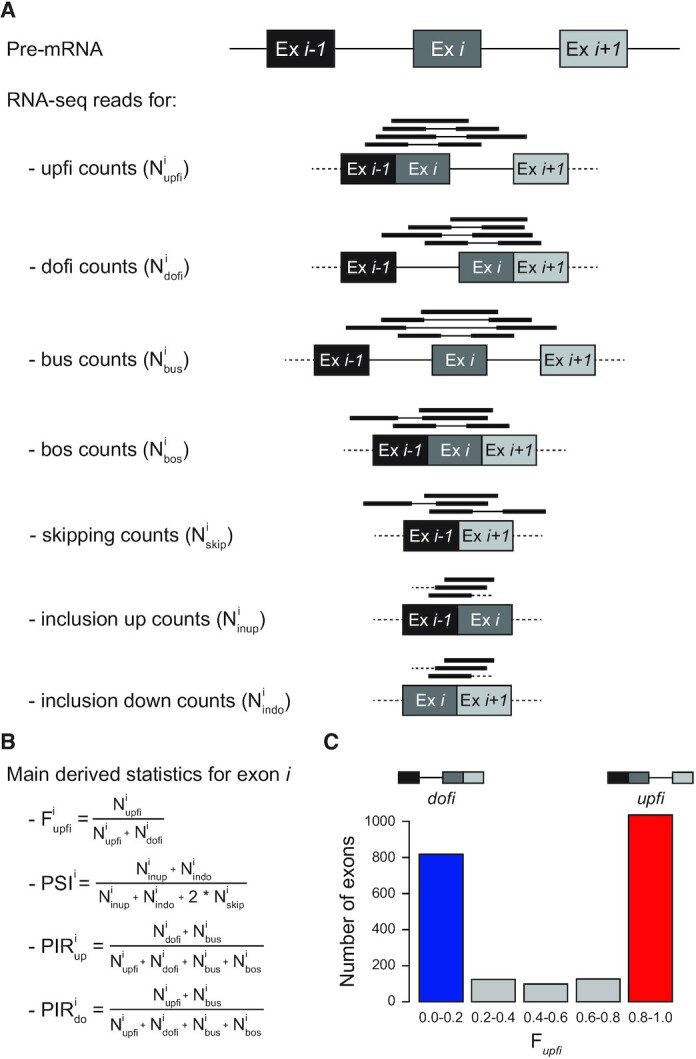
Summary of AISO and splicing related statistics provided by Insplico. (A) Schematic representation of mapped short reads that are informative for each type of processing state for a specific exon (Ex i). These include counts for exons in which either the upstream or downstream intron has been spliced first (upfi and dofi, respectively), and for which none or both of the adjacent introns have been spliced (bus and bos, respectively). It also includes exon-exon junction counts, for skipping or inclusion, used to derive exon inclusion levels (skip, inup and indo). Thin lines in mapped reads represent the non-sequenced fragment of paired-end reads. (B) Main statistics used in this study, as provided by Insplico. (C) Histogram showing the distribution of a representative set of exons based on their Fupfi values. Throughout the study, exons with Fupfi ≥0.8 (red) and ≤0.2 (blue) are considered upfi and dofi exons, respectively.