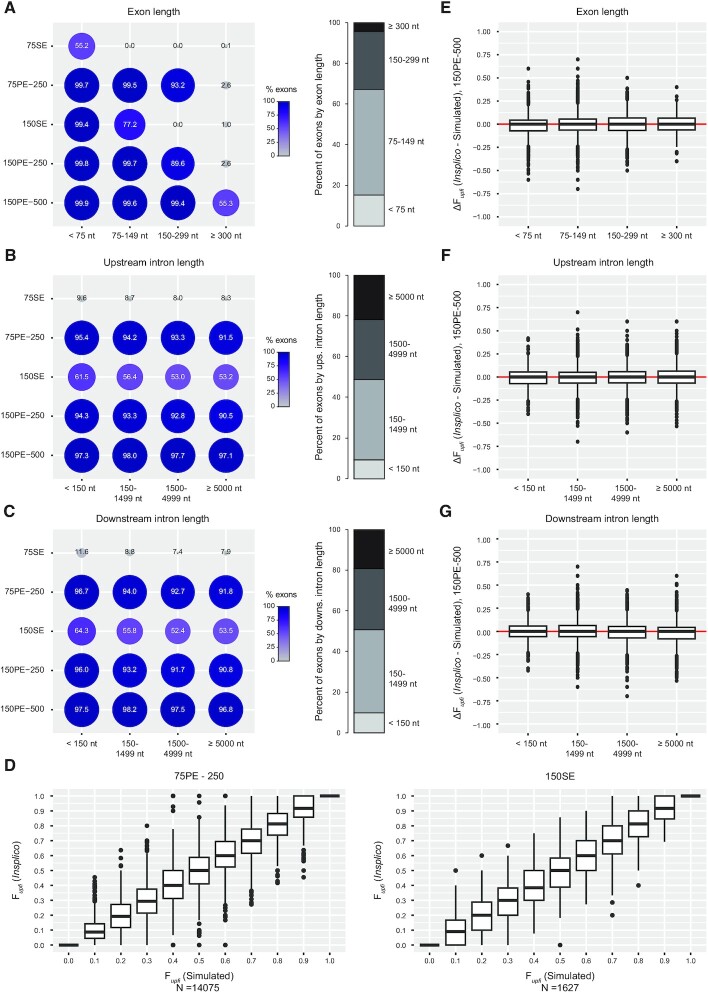
Figure 2.
Assessment of potential Insplico biases using simulated reads. (A–C) Right: Dot plots showing the percent of exons for which at least one upfi or dofi count could be extracted using Insplico for different ranges of exon length (A), upstream intron length (B) or downstream intron length (C), using simulated RNA-seq reads of different lengths (75 or 150 nts) that are either single-end (SE), or paired-end (PE) with two possible average insert sizes (250 or 500 nts). For example, 150PE-500 corresponds to 150-nt PE reads with an average insert size of 500 nts. Dot size and heatmap are relative to the percent of detected exons. Left: proportion of internal exons for each feature range in human. (D) Boxplots of Fupfi values as quantified by Insplico (Y axes) for exons with N(upfi + dofi) ≥ 10 for each simulated median Fupfi group (X axes) for 75PE-250 and 150SE reads. (E–G) Difference between the Fupfi values calculated by Insplico and those expected from the simulations (Y axes) for each range of exon length (E), upstream intron length (F) or downstream intron length (G), for simulated 150PE-500 reads. Median values around the red line (Y = 0) imply no bias in Insplico’s quantifications. Different types of simulated reads yielded similar results.

