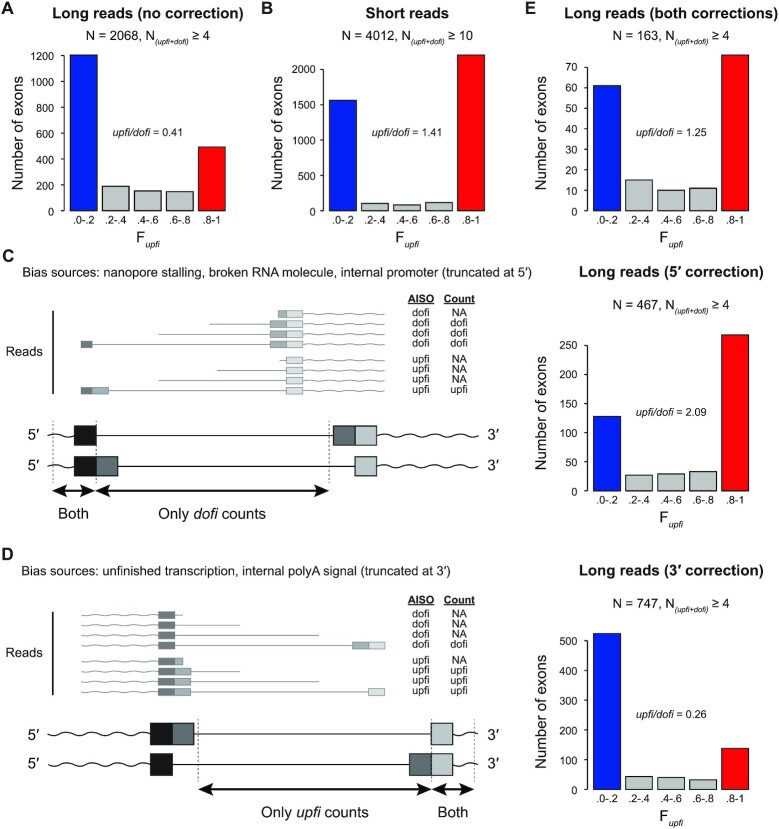
Figure 4.
Re-analysis of AISO patterns using Drexler et al. (2020) ONT data. (A) Distribution of internal exons according to Fupfi values generated by Insplico using ONT reads from Drexler et al. (16) without correction reproduces the excess of dofi exons (blue) reported by the original study. (B) Distribution of internal exons according to Fupfi values generated by Insplico using Illumina short reads for the same cell type as in (A). (C, D) Left: Schemes depicting how ONT reads can be truncated at their 5′ (C) or 3′ (D) ends, which is predicted to bias the total read count against upfi and dofi RNA molecules, respectively. Schemes depict the focus internal exon (dark grey) and the upstream (black) and downstream (light grey) exons, which are separated by equally long neighboring introns in this example. Wavy lines correspond to other parts of the RNA molecule. ONT read examples are shown smaller and with transparent coloring. The table indicates, for each depicted ONT read, the real AISO pattern (‘AISO’) and the count obtained by Insplico (‘Count’). Right: impact of corrections done by Insplico for each these biases in the AISO profiles from (A). (E) Distribution of internal exons according to Fupfi values generated by Insplico using ONT reads from Drexler et al. (16) with full correction more closely reproduces the AISO profile obtained by short reads.

