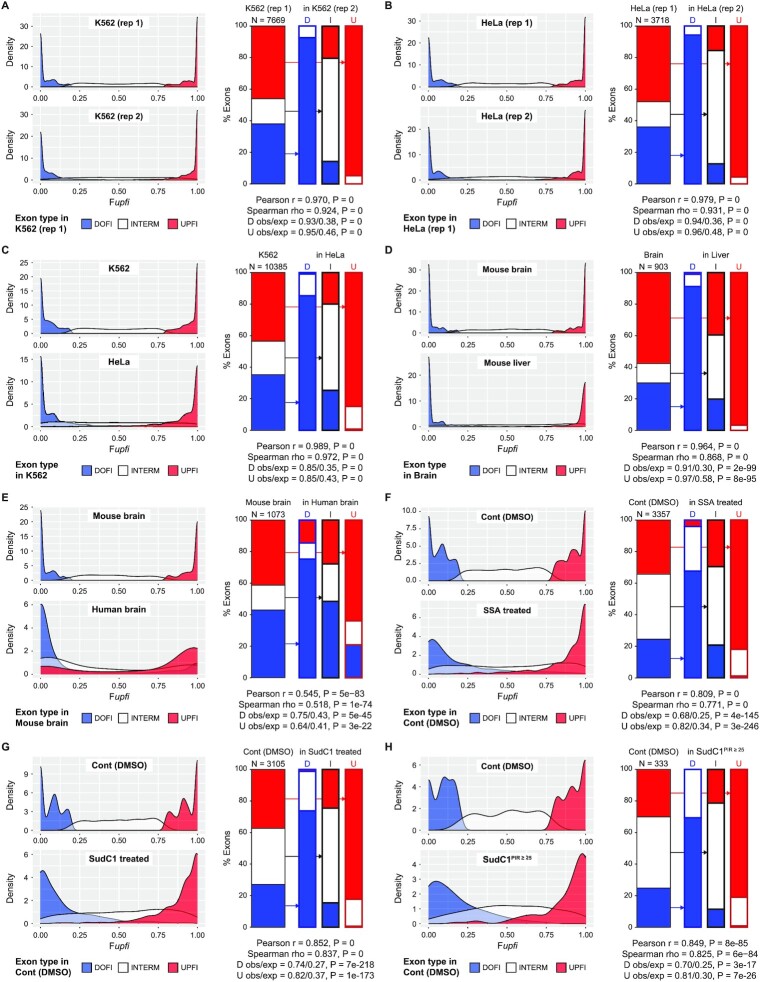
Figure 5.
AISO patterns are largely consistent across cell and tissue types and experimental conditions. For each panel (A-H), for a given sample (e.g. ‘K562 (rep 1)’), its AISO profile is derived showing the exons that are strongly upfi (red), dofi (blue) or intermediate (white), either through Fupfi density plots (left) or displaying the proportion of each category using stack plots (right). Then, density plots for Fupfi values for the same exons are shown below for the other sample (e.g. ‘K562 (rep 2)’), but each exon is colored according to the AISO pattern in the first sample. Moreover, upfi, intermediate, and dofi exons in the first sample are separately interrogated in the second sample, as indicated by the arrows (columns ‘U’, ‘I’ and ‘D’, respectively), and their proportion of AISO profiles displayed (further explanations can be found in Supplementary Figure S2A). In addition, results from various statistical tests are provided for each comparison. (A, B) Consistent AISO patterns across biological replicates in K562 cells (A, data from (8)) and in HeLa cells (B, data from (31)). (C, D) Consistent AISO patterns between human HeLa and K562 cells (C) and mouse brain and liver tissues (D, data from this study). (E) Significant evolutionary conservation of AISO patterns among orthologous exons in human and mouse brain (data from (49) and this study). (F–H) Consistent AISO patterns in HeLa cells treated with DMSO (control) or spliceostatin (SSA) (F) or sudemycin C1 (SudC1) (G). AISO patterns were largely consistent even for exons for which both neighboring introns were highly affected by drug treatment (ΔPIR > 0.25) (H). Data from (32).

