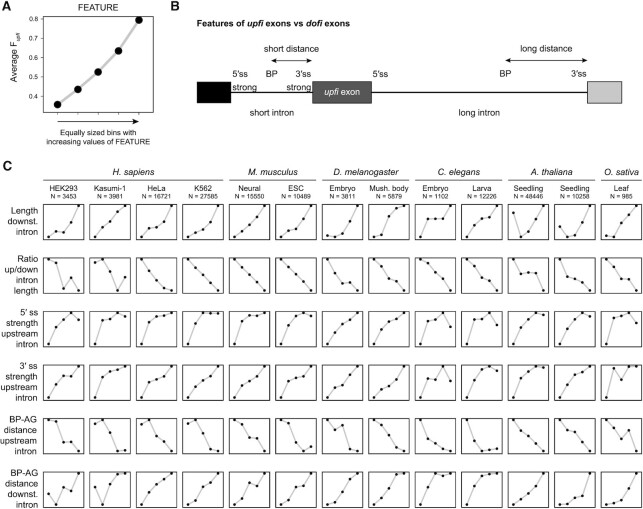
Figure 6.
Genomic features universally associated with AISO. (A) Schematic representation of the plots obtained in this analysis. For a given feature, the average of Fupfi values (Y axis) is shown for five equal-sized groups of exons binned by increasing values of that feature (X axis). Consistently increasing or decreasing associations are considered. (B) Summary representation of the features consistently associated with exons whose upstream intron is spliced first. BP, branch point; ss, splice site. (C) Summary plots for the main features universally associated with AISO patterns across samples and species. Further details for all features as well as violin plots showing the full Fupfi distributions are provided in Supplementary File 1.

