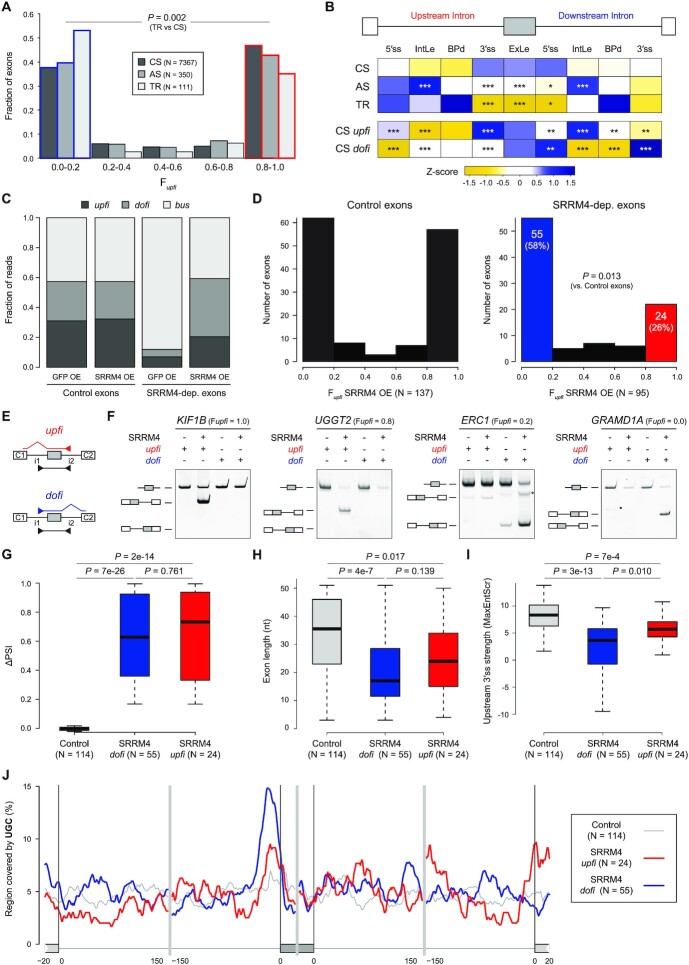
Figure 7.
AISO patterns differentiate two subsets of SRRM4-dependent microexons. (A) Distribution of constitutive (CS), alternative (AS) and tissue-regulated (TR) exons according to Fupfi values. P-value corresponds to the comparison between upfi (red) and dofi (blue) TR vs. CS exons using a two-sided Fisher's Exact test. (B) Z-scored median values for each feature for each exon type as well as CS exons that are strongly upfi (‘CS upfi’) and dofi (‘CS dofi’). IntLe, intron length; BPd, distance from branch point to 3′ ss; ExLe, exon length. P-values correspond to Bonferroni-corrected Wilcoxon Rank-Sum tests against the CS distributions for each feature. * 0.05 < P ≤ 0.01, ** 0.01 < P ≤ 0.001, *** P < 0.001. All details for all features are provided in Supplementary File 2. (C) Distribution of unprocessed reads (upfi, dofi and bus) for control and SRRM4-dependent (SRRM4-dep.) microexons in each condition. (D) Distribution of exons according to Fupfi values for control (left) and SRRM4-dependent (right) microexons in HEK293 cells ectopically expressing human SRRM4. P-value corresponds to the comparison between upfi (red) and dofi (blue) control and SRRM4-dependent exons using a two-sided Fisher's Exact test. (E, F) Validation of AISO for four SRRM4-dependent microexons with upfi or dofi patterns in SRRM4-expressing HEK293 cells. Primers in upstream and downstream introns (i1 and i2) in combination with exon junction primers between the exon C1 upstream and the microexon (upfi, red) and between the microexon and the exon C2 downstream (dofi, blue) were used for specific detection of partially processed transcripts, as depicted in (E). Unidentified amplification products in F are indicated with an asterisk. (G–I) Distributions of ΔPSI (SRRM4 OE vs control; G), exon length (H) and 3′ ss strength of the upstream intron (using the MaxEntScr metric; I) for control and SRRM4-dependent exons with strong dofi (blue) and upfi (red) patterns. P-values correspond to Wilcoxon Rank-Sum tests. (J) RNA map showing the percent sequence covered by UGC motifs using a sliding window of 25 nts for each microexon type. For C-J, only microexons with N(upfi + dofi) ≥ 5 in the SRRM4 OE sample were considered for all the analyses.

