Figure 2.
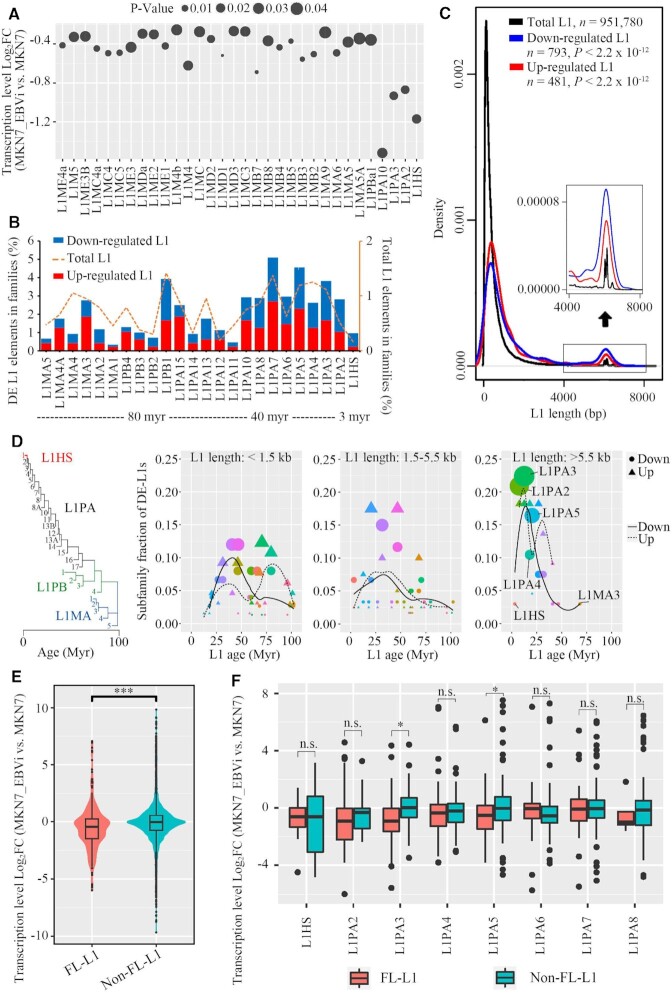
Young and full-length L1s were the most repressed L1s in EBV-infected gastric cancer cells. (A) Dot plot showing log2FC and P-value of L1 expression for subfamilies with significant expression change (MKN7_EBVi versus MKN7). (B) Subfamily analysis of DE-L1s: subfamily distribution of DE-L1s (down-regulated L1, blue; up-regulated L1, red) and subfamily distribution of human genome-wide L1s (dotted lines). Myr, million years. (C) Size distribution of the DE-L1s (down-regulated L1, blue; up-regulated L1, red; total L1s, black). The y-axis is the fraction of L1s ranked by length. A zoom-in view of the size distribution (length >4 kbp) is shown as an inset. P-value, two-tailed Kolmogorov–Smirnov test. (D) Dot plot showing the fraction of DE-L1 subfamilies (center values) as a function of L1 length (three size groups are presented) and age [phylogenetic analysis was performed to predict the age of L1 subfamilies (47)]. Colored dots represent different L1 families, with areas proportional to the number of DE-L1s. Circle, down-regulated L1s. n = 202. Triangle, up-regulated L1s. n = 127. The logistic regression lines for down- (continuous line) and up-regulated (dotted line) L1s are plotted. (E) Violin plot showing the log2FC of FL-L1s and non-FL-L1s (MKN7_EBVi versus MKN7). A total number of 8037 L1 loci were included in the analysis. (F) Box plot showing the log2FC of FL-L1s and non-FL-L1s for each subfamily (MKN7_EBVi versus MKN7; FL-L1s, red; non-FL-L1s, blue). Boxes represent: central lines, median; limits of the boxes, interquartile range of values; black dots, outliers. The asterisks represent the statistical P-value (*P <0.05, **P <0.01, ***P <0.001, ****P <0.0001, Mann–Whitney U-tests).

