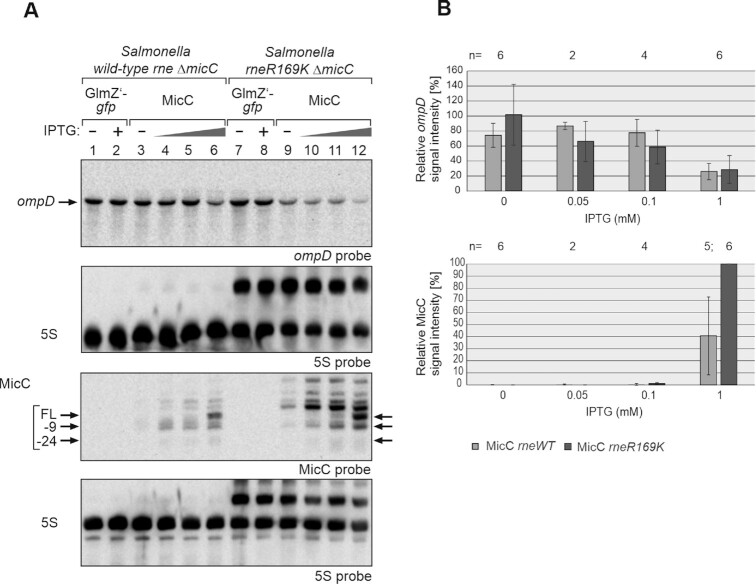
Figure 8.
MicC does not require the 5′P sensory pocket of RNase E for downregulation of ompD in vivo. (A) Northern blot experiment addressing ompD steady state levels in presence of MicC in Salmonella Typhimurium strains Z1266 (wild-type rne, ΔmicC) and Z1267 (rneR169K, ΔmicC), respectively. The strains carried either plasmid pYG215 (glmZ’-gfp, lanes 1, 2, 7, 8) or plasmid pYG314 (micC, lanes 3–6 and 9–12). Transformants were grown in absence or presence of IPTG, 0.05, 0.1 and 1 mM IPTG were used in case of micC and 1 mM in case of glmZ’-gfp, to induce transcription of RNA genes. Total RNAs (1.5 μg each) were separated on two denaturing PAA gels, containing 5% or 8% acrylamide, and were subsequently blotted. The blot resulting from the 5% PAA gel was hybridized with a probe detecting ompD (first panel from top), while the other blot was probed for MicC (third panel from top). Membranes were re-probed for 5S rRNA to obtain loading controls. Full-length (FL) MicC and its decay products are indicated with arrows. (B) Quantification of Northern blots. Bar graphs presenting the average normalized signal intensities and SD of 2–6 independent experiments. ompD mRNA signal intensities, in presence of wild-type (WT) rne (light grey) and rneR169K (dark grey), were compared to ompD signal intensities obtained in presence of GlmZ’-gfp in the respective strain background (lanes 1, 2 or 7, 8; = 100%) and normalized to the corresponding 5S rRNA loading controls (top graph). MicC signal intensities, in presence of wild-type (WT) rne (light grey) and rneR169K (dark grey) were compared to the strongest signal obtained for MicC (lane 12; = 100%) and normalized to the 5S rRNA loading controls (bottom graph). In the rneR169K strain, signal intensities of the 5S signal and the 5S rRNA precursor were summed up for normalization.

