Figure 2.
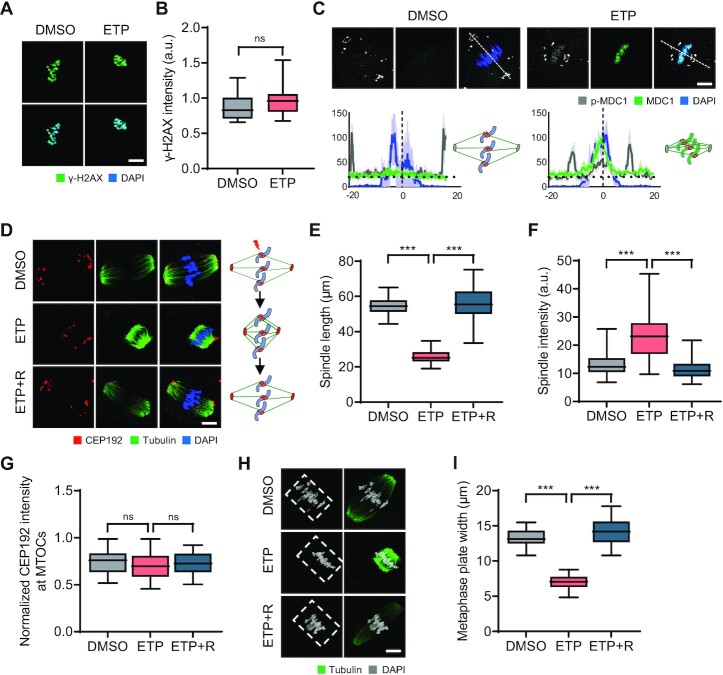
Chromosomal recruitment of p-MDC1 and dynamic changes in spindle and chromosome organization following DSB induction. (A) Representative images of control and ETP-treated MI oocytes stained with γ-H2AX antibody. Scale bar, 10 μm. (B) Quantification of γ-H2AX intensity. Data are presented as the mean ± SEM from three independent experiments. ns, not significant. (C) Representative images of MI oocytes stained with MDC1 and p-MDC1 antibodies. Scale bar, 10 μm. Profile of MDC1 and p-MDC1 signals between opposite spindle poles is measured along the dashed lines drawn on the upper images and shown with schematic illustration of spindle and chromosomes. (D) Representative images and schematic illustration showing spindle microtubules and MTOCs after ETP treatment and recovery (ETP + R). Scale bar, 10 μm. (E–G) Quantification of spindle length and intensity and CEP192 intensity at MTOCs. CEP192 intensity was normalized to the DAPI signal (CEP192/DAPI). Data are presented as the mean ± SEM from three independent experiments. ***P < 0.0001. ns, not significant. (H) Representative images of spindle and chromosomes in MI oocytes. Chromosome regions aligned at the metaphase plate are indicated by white dashed boxes. Scale bar, 10 μm. (I) Quantification of metaphase plate width. ***P < 0.0001.

