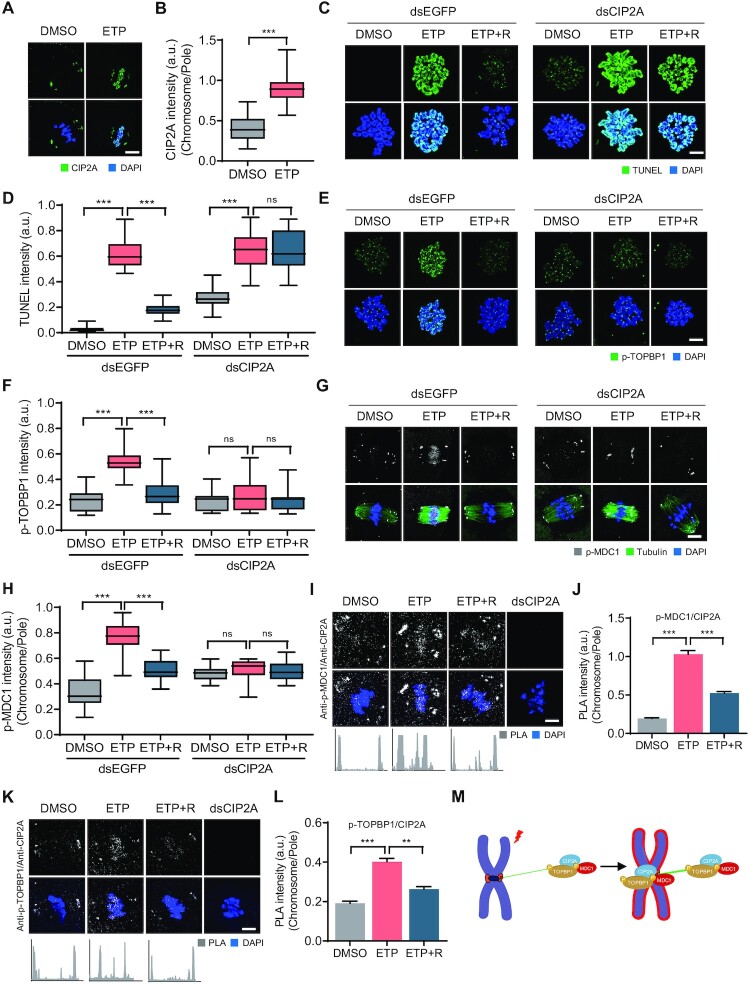
Figure 4.
CIP2A-dependent chromosomal recruitment of p-MDC1 and p-TOPBP1. (A) Representative images of control and ETP-treated MI oocytes stained with CIP2A antibody. Scale bar, 10 μm. (B) Ratio of CIP2A intensity at chromosomes over spindle poles. Data are presented as the mean ± SEM from three independent experiments. ***P < 0.0001. (C, E, G) Representative images of chromosome spreads from control, ETP-treated, and recovered (ETP + R) oocytes, which were microinjected with either dsEGFP or dsCIP2A. TUNEL, p-TOPBP1 and p-MDC1 signals are shown. Scale bar, 10 μm. (D, F, H) Quantification of TUNEL and p-TOPBP1 intensity and ratio intensity of p-MDC1 at chromosomes over spindle poles (chromosome/pole). Data are presented as the mean ± SEM from three independent experiments. ***P < 0.0001. ns, not significant. (I, K) Representative images of PLA and profile of PLA signals between opposite spindle poles. Oocytes injected dsCIP2A were used as control. Scale bar, 10 μm. (J, L) Quantification of PLA intensity. Data are presented as the mean ± SEM from three independent experiments. **P < 0.001, ***P < 0.0001. (M) Schematic illustration showing the chromosomal recruitment of CIP2A–MDC1–TOPBP1 complex from spindle pole in response to DNA damage.

