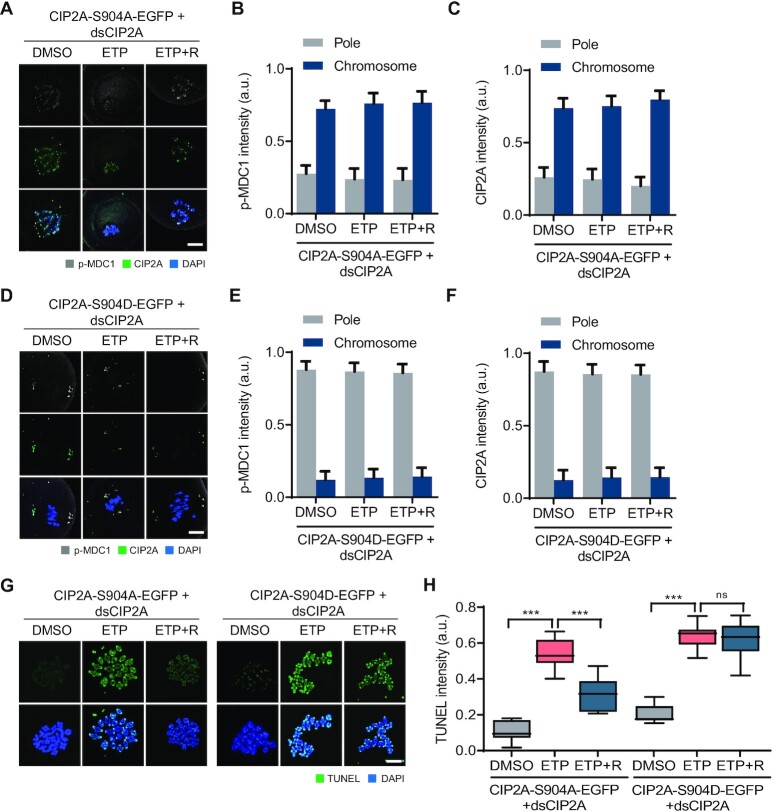
Figure 7.
CIP2A dephosphorylation by PLK1 inactivation after DNA damage. (A, D) Representative images showing CIP2A and p-MDC1 signals in oocytes co-injected with dsCIP2A and mRNAs encoding either CIP2A-S904A-EGFP or CIP2A-S904D-EGFP. Scale bar, 10 μm. (B, C, E, F) Quantification of CIP2A and p-MDC1 localization (chromosomes vs pole). Data are presented as the mean ± SEM from two independent experiments. ***P < 0.0001. ns, not significant. (G) Representative images showing TUNEL signals in oocytes co-injected with dsCIP2A and mRNAs encoding either CIP2A-S904A-EGFP or CIP2A-S904D-EGFP. Scale bar, 10 μm. (H) Quantification of TUNEL intensity. Data are presented as the mean ± SEM from two independent experiments. ***P < 0.0001. ns, not significant.

