Figure 4.
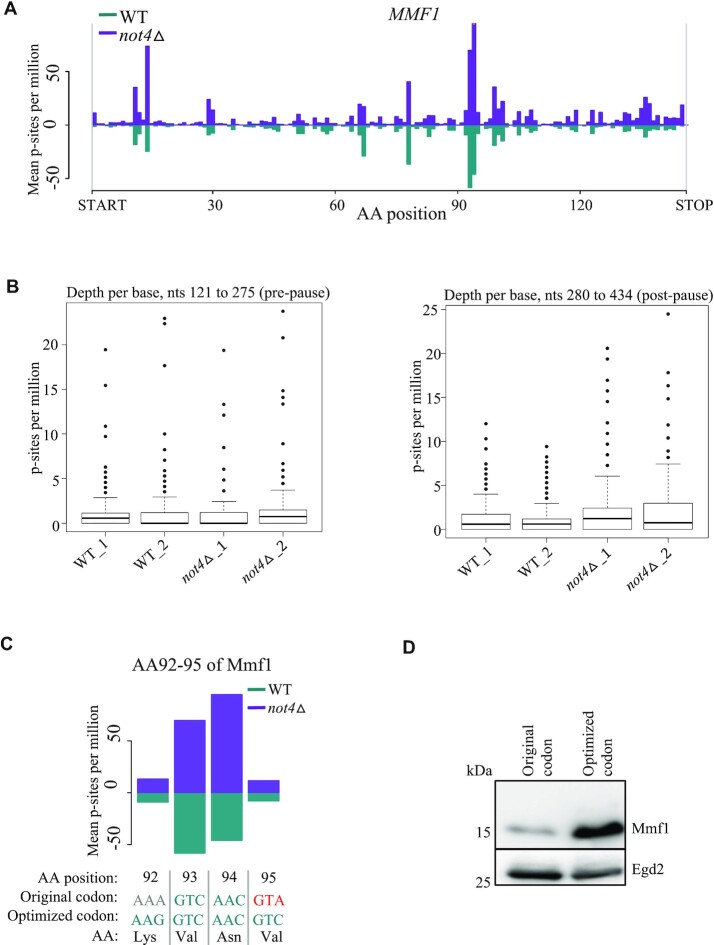
Translation dynamics according to codon optimality contributes to regulate Mmf1 expression. (A) Profiles of ribosome footprints (P-site depth plots) on MMF1 with footprints in wild type cells in green and those in not4Δ cells in purple. The number of P-sites, per million genome-wide for each sample, covering each CDS codon with corresponding amino acid position indicated (AA position) is calculated, averaged for each condition and plotted. (B) Quantification of mRNA footprints in wild type and not4Δ cells for duplicate samples on equal segments of the mRNA before (left) and after (right) the apparent ribosome pausing site. Boxplots of P-sites per million for each base of the MMF1 CDS in WT and not4Δ cells for the region between the large pause and the stop codon (nucleotides 280–434, right panel) and an equally-sized region just upstream of the pause (nucleotides 121–275, left panel). Only the region post-pause shows significant changes (DESeq2 p-value = 3.19e-5). (C) Visualization of the 4 codons at the MMF1 ribosome pause site with encoded amino acids. Codons in blue are amongst the 15 most optimal and in red amongst the 15 most non-optimal yeast codons. The first line indicates the position, the second line indicates the codon in the wild type MMF1 sequence and the third line indicates the mutations created to change codon optimality but not the encoded amino acid. (D) Expression of the MMF1 reporter with the wild type sequence (‘Original codon’) or the codon-optimized sequence (‘Optimized codon’) around the pause site in cells growing exponentially was evaluated by western blotting with antibodies to Flag or with antibodies to Egd2 to control for protein loading.

