Figure 3.
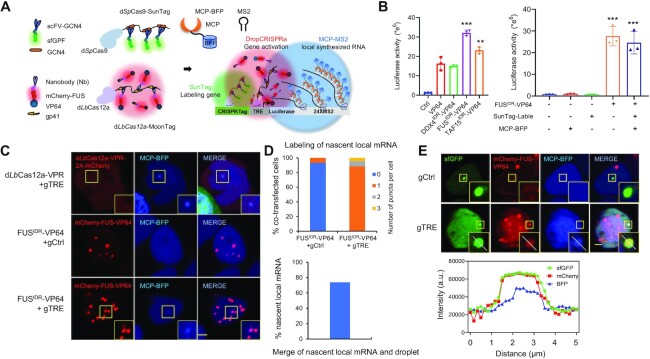
The DropCRISPRa system forms a droplet at the target site to drive RNA synthesis. (A) Schematic of the experimental design. The HEK293T reporter cell line contained a CRISPRTag-TRE-luciferase-24×MS2 DNA fragment at the ACTB locus. The dSpCas9–sfGFP-SunTag system (green) labeled the target site via targeting the CRISPRTag sequence, the dLbCas12a–mCherry-MoonTag system (red) activated luciferase expression via targeting the TRE promotor and MCP–BFP was used to visualize the MS2-tagged luciferase mRNA. (B) Luciferase activity in the reporter cell line after transfection with the indicated gene activation systems. Mean values are presented with the SD, n = 3 biological triplicates. ***P < 0.001, **P < 0.01, one-way ANOVA test versus VP64. (C) Representative image of reporter cells transfected with the indicated systems, including dLbCas12a-VPR-2A–mCherry or DropCRISPRa-MoonTag gene activation systems and MCP–BFP for labeling of nascent local mRNA. (D) Quantifications of local mRNA labeling efficiency and the merge efficiency of local mRNA and the FUSIDR–VP64 droplet, n ≥ 80 cells. (E) Co-localization of the target gene, the FUSIDR–VP64 droplet and the nascent luciferase mRNA in the nucleus. The line scan result along the white lines in the merged droplet is shown. Scale bar, 5 μm.

