Figure 5.
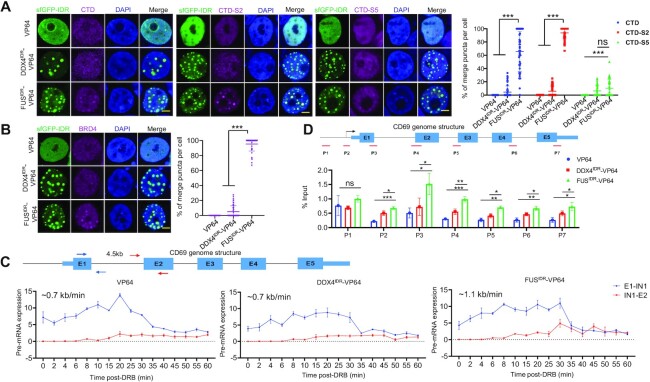
The DropCRISPRa system compartmentalizes RNAPII and BRD4 to the droplets and enhances the transcription rate. (A and B) GFP fluorescence and immunofluorescence staining of transcriptional regulators, i.e. RNAPII-CTD, Ser2 phosphorylated CTD (CTD-S2), Ser5 phosphorylated CTD (CTD-S5) and BRD4, in the HEK293T cells transfected with the indicated systems targeting HBG1. Quantification of co-localization efficiency is shown on the right, n ≥ 50 cells. Scale bar, 5 μm. (C) Analyses of the transcription elongation rate of the target gene activated by the indicated systems. The genome structure of the CD69 gene and the primer pairs used to amplify the regions spanning the 4.5 kb intron 1 are shown on the top. The HEK293T cells were transfected with the indicated systems targeting CD69 and, 48 h later, treated with DRB for 3 h to reversibly block transcription elongation. Total RNA was harvested at the indicated intervals after the removal of DRB and used for RT–qPCR with the indicated primer pairs. The expression values were plotted relative to the DRB-untreated group. (D) ChIP-PCR revealed the RNAPII-CTD-S2 occupancy along the CD69 gene. Schematic diagram showing the primer sets covering the promoter-distal region (p1), promoter-proximal region (p2) and gene body region (p3–p7) (top). Relative enrichment for each site was calculated by normalization to input control (bottom). **P < 0.01, ***P < 0.001, one-way ANOVA test versus VP64.

