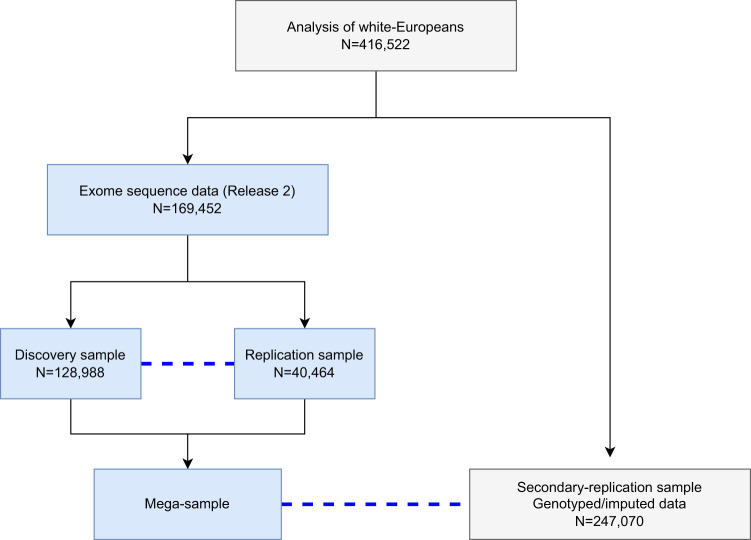
Fig. 1. An illustration of samples used in the analysis.
We included in the analysis 416,522 samples after excluding individuals who are not white-European, do not meet the inclusion criteria, or provided inconsistent answers. Blue dashed lines indicates the replication sample which was used for the discovery and mega-analysis. Associations identified in the discovery sample are only replicated using the exome replication sample and not the secondary-replication sample. The replication sample consists of individuals included in UK Biobank Release 1. For replication, permutation is used to estimate empirical p-values adjusting for the number of variants/genes and phenotypes brought to replication. There is no overlap of individuals in the discovery, replication, and secondary-replication samples. All samples were used in the single-variant analysis and only those samples highlighted in light blue were used in the rare-variant aggregate analysis. There was no available replication sample for the mega-analysis of rare-variant aggregated association testing.

