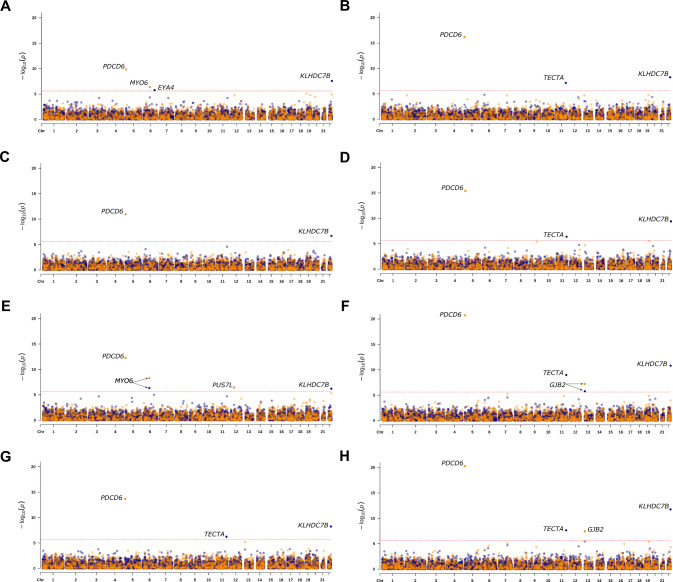
Fig. 2. Manhattan plots for the discovery and mega-sample rare-variant aggregate association analysis.
Results for the discovery sample are shown for the analysis of H-aid (A), H-diff (B), H-noise (C), and H-both (D). Results for the mega-sample are shown for the analysis of H-aid (E), H-diff (F), H-noise (G), and H-both (H). For each Manhattan plot, the blue dots display the result for the analysis of predicted loss of function (pLoF) variants and the orange dots for missense and pLoF variants. The threshold for exome-wide significance (p < 2.5 × 10⁻⁶) is indicated by a red dotted line. Genes that reached exome-wide significance are annotated.

