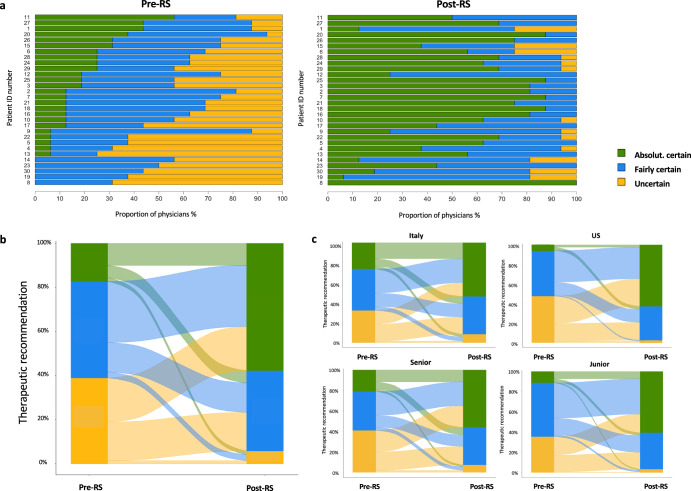
Fig. 1. Change of confidence in the therapeutic decision after RS.
a Confidence in the therapeutic decision pre- and post- RS results for each case. b Change of confidence in therapeutic recommendations pre- and post- RS results in the overall population. c Change of confidence in therapeutic recommendations pre- and post- RS results by oncologist country and experience. In (b and c), Y axes indicate the degree of confidence for all the therapeutic recommendations provided by each oncologist for each patient. Alluvial plots describe the change of confidence for each individual therapeutic recommendation pre- and post- RS in the overall population (b) or by oncologist country and experience (c).

