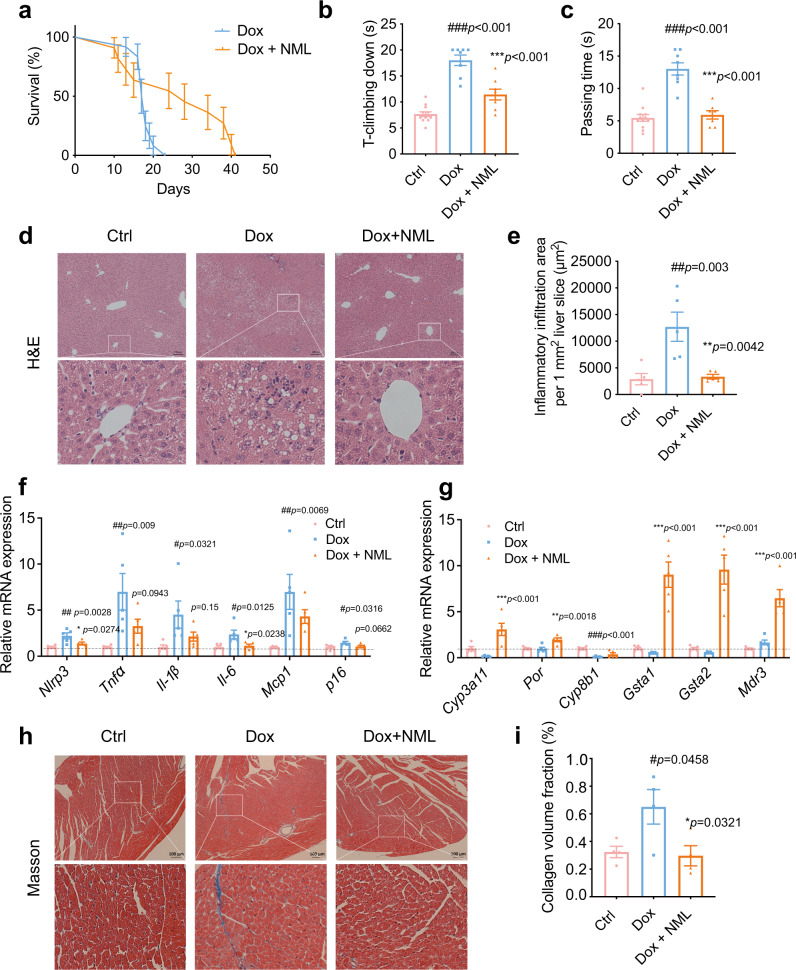
Fig. 8. Effects of nomilin on lifespan and healthspan in doxorubicin-induced senescence mice.
a Survival curve of accelerated ageing mice. The mice were treated with doxorubicin (5 mg/kg, three times a week) and nomilin (50 mg/kg/day). (n = 12 for Dox, n = 11 for Dox+NML) b T-climbing down in pole test (n = 12 for Ctrl, n = 8 for Dox and Dox+NML). c Passing time in beam balance test (n = 12 for Ctrl, n = 8 for Dox and Dox+NML). d H&E staining of the liver sections. e Inflammatory infiltration area per mm2 liver sections in (d), (n = 5/group). f The expression of senescence-related secretory phenotypic genes in the liver of doxorubicin-treated mice (n = 5/group). g The expression of PXR downstream genes in the liver of doxorubicin-treated mice. β-Actin was used as an internal control (n = 5/group). h Cardiac fibrosis induced by doxorubicin administration, determined by Masson’s trichrome staining. i The quantitative analysis of fibrosis area in (h), (n = 4/group). The mice were treated with doxorubicin (5 mg/kg, three times a week) for 2 weeks and nomilin (50 mg/kg/day for 4 weeks). The data were shown as mean ± SEM. p-values were determined by one-way ANOVA test (b, c, e–g, i). ###p < 0.001 vs the control group; ***p < 0.001 vs the doxorubicin group. Dox doxorubicin, NML nomilin.

