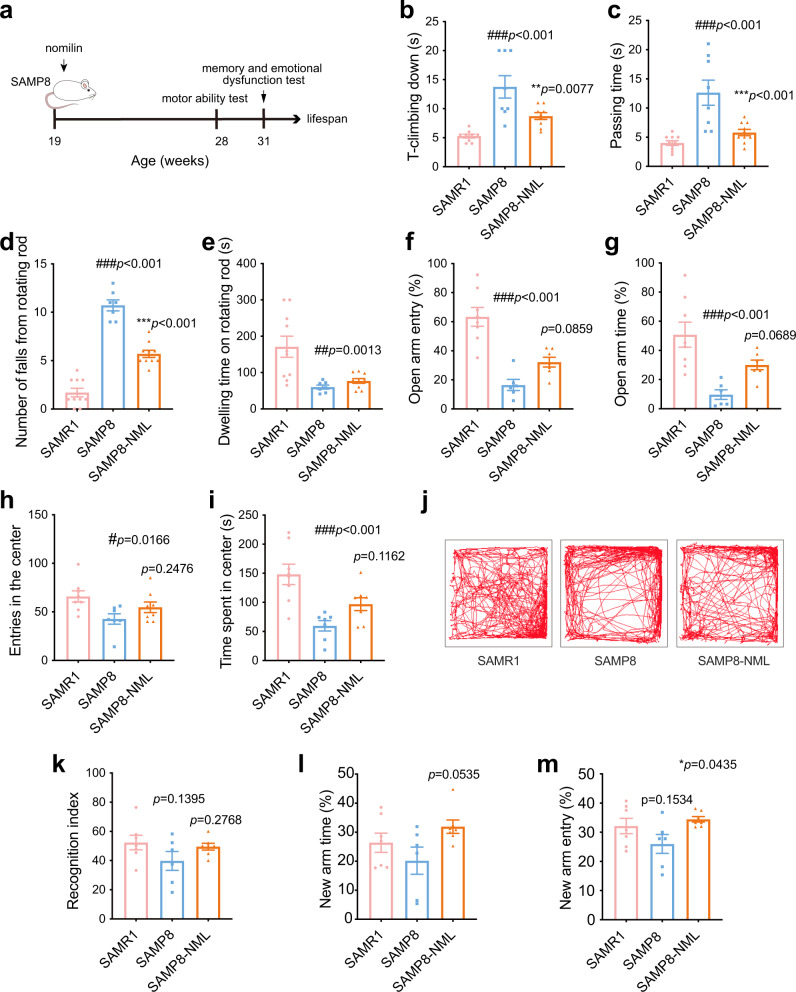
Fig. 9. Effects of nomilin on healthspan in SAMP8 mice.
a Timeline for drug treatment and behaviour test. b T-climbing down in pole test (n = 8 for SAMP8, n = 9 for SAMR1 and SAMP8-NML). c Passing time in beam balance test (n = 8 for SAMP8, n = 10 for SAMR1 and SAMP8-NML). d Number of falls from rotating rod (n = 7 for SAMP8, n = 10 for SAMR1 and SAMP8-NML). e Dwelling time on rotating rod (n = 7 for SAMP8, n = 10 for SAMR1 and SAMP8-NML). Proportion of times entering the open arm (f, n = 8 for SAMR1, n = 6 for SAMP8, n = 7 for SAMP8-NML) and Proportion of exploration time in the open arm (g, n = 8 for SAMR1, n = 6 for SAMP8, n = 7 for SAMP8-NML) in elevated-plus maze. Entries in the centre (h, n = 7 for SAMP8, n = 8 for SAMR1 and SAMP8-NML) and time spent in centre (i, n = 7 for SAMP8, n = 8 for SAMR1 and SAMP8-NML) in open field. j Trajectory in open field. k Recognition index of mice in novel object recognition test (n = 6 for SAMP8, n = 7 for SAMR1 and SAMP8-NML). l Proportion of time exploring the new arm in Y maze (n = 6 for SAMP8, n = 7 for SAMR1 and SAMP8-NML). m Proportion of times entering the new arm in the Y maze (n = 6 for SAMP8, n = 7 for SAMR1 and SAMP8-NML). The data were shown as mean ± SEM. p-values were determined by one-way ANOVA test (b–i, k–m). ###p < 0.001 vs the SAMR1 group; ***p < 0.001 vs the SAMP8 group.

