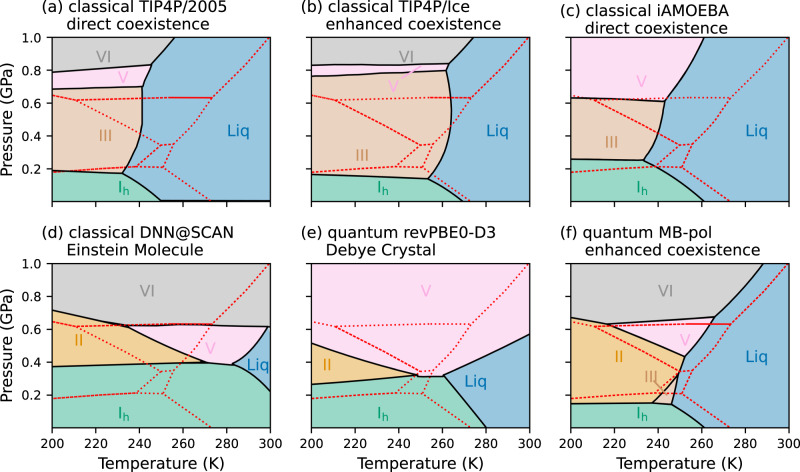
Fig. 4. Comparison among state-of-the-art simulations.
a Classical phase diagram of TIP4P/2005 from ref. 33 calculated using direct-coexistence simulations. b Classical phase diagram of TIP4P/Ice from ref. 113 calculated using enhanced-coexistence simulations. c Classical phase diagram of iAMOEBA from ref. 34 calculated using direct-coexistence simulations. d Classical phase diagram of DNN@SCAN from ref. 36 calculated using the Einstein Molecule method. e Quantum phase diagram of revPBE0-D3 from ref. 35 calculated using the Debye Crystal method. f Quantum phase diagram of MB-pol calculated in this study using enhanced-coexistence simulations. The phase diagrams that are shown in a, c, d, and e were digitized from the original references. In each panel, the regions of stability for ice Ih, II, III, V, and VI and liquid water are shown as areas colored in green, orange, gray, brown, pink, and blue, respectively, and the experimental phase diagram5 is shown using dotted red lines.

