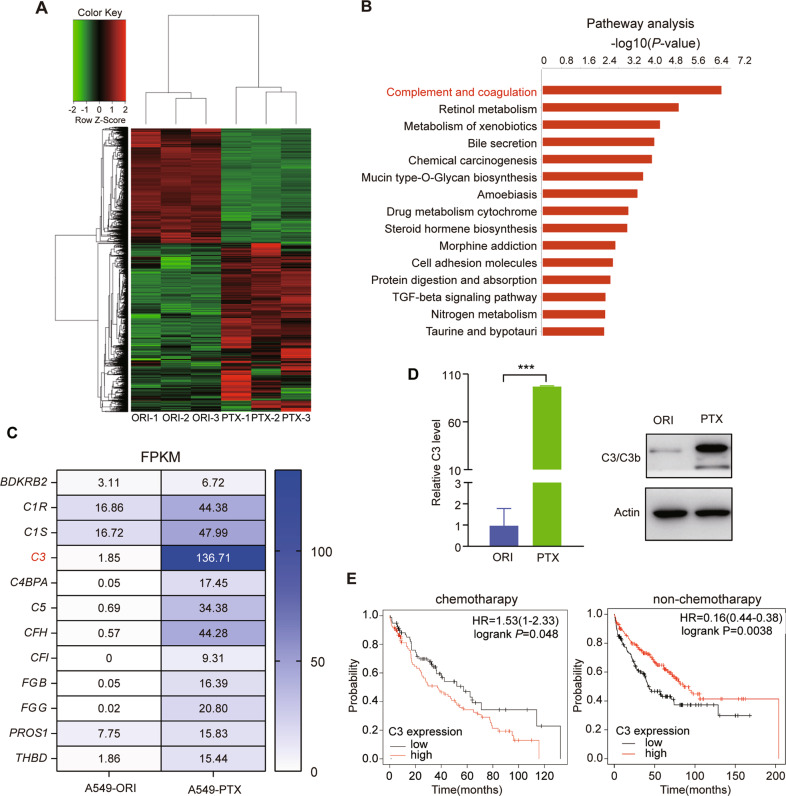
Fig. 1. C3 is upregulated in PTX-resistant NSCLC A549 cells.
A Heatmap of differentially expressed genes between A549-ORI and A549-PTX cells by RNA-Seq. B The top 15 enriched signaling pathways based on the 2914 upregulated genes in A549-PTX cells. C FPKM values of genes in the complement and coagulation cascade pathways. D C3 expression at the mRNA and protein levels in A549-ORI and A549-PTX cells measured by qRT‒PCR and immunoblotting (IB) assays. Data represent the mean ± SD, n = 3, two-tailed Student’s t test. E Kaplan‒Meier survival analysis for the relationship between the survival rate of chemotherapy-treated or nonchemotherapy-treated lung cancer patients and the expression of C3 (by log-rank). HR, hazard ratio. *P < 0.05, **P < 0.01, ***P < 0.001 and ****P < 0.0001.

